or ‘my hack for Over The Air 2010’
 Yesterday was Over The Air 2010 – a very cool event for mobile developers, that really warrants a post to itself, but I’m too tired so that will have to wait for another day.
But while I was there, I had a go at the hack challenge. I’m pleased that there was a fair amount of interest in what I did, so in this post, I want to share some of the technical details.
The hack centred around getting access to (pseudo-)realtime data about UK roads. It turns out that there is an effort to make traffic and road monitoring data available in a consistent, interchangeable format: DATEX II.
The DATEX site has a list of documentation for the traffic data made available for England, Scotland, Sweden, Italy, Spain, Portugal, Netherlands, and regions in France and Germany. For a data geek, this was quite a cool find 🙂
I only had 24 hours to play, so started with the data available for England – covering the motorway and trunk roads. The web page includes a 39-page PDF which documents the data that the National Traffic Control Centre publishes for England.
The nice thing about DATEX II being an agreed standard is that although I spent the evening working with the English traffic data, once the code was done, there wouldn’t be anything to stop me using the same code with the Scottish data too.
They publish a lot of data – more than I realised was being collected, let alone made publicly available. This chimed well with the keynote on Saturday morning by the brilliant Tim Berners-Lee, in which he talked about the importance of publicly available data.
The data includes:
- current and future planned roadworks
- current and future planned events expected to affect traffic
- unplanned events affecting traffic
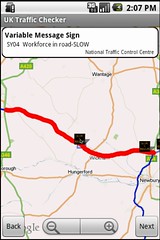
- the current message being displayed on variable message signs (the electronic traffic signs that can be set to display text messages like “don’t drink and drive”)
- the current graphic being displayed on matrix signs (those square electronic displays that can display icons like which motorway lanes are closed)
- information about traffic on monitored stretches of road
This was an impressive list – is it just me, or is the ability to find out what is currently written on the electronic sign hanging over every major road in the country seriously cool? No? Okay… so I’m a geek. 🙂
But beyond the list, what was impressive was the amount of detail.
 For roadworks, you can find out not only where they are, but what type of roadworks they are – e.g. resurfacing, barrier repairs, bridge repairs, etc., what times of day they will be active, when they are expected to finish, the anticipated level of disruption, number of lanes to be closed, and much more.
For events, you can find out the type of event (e.g. if it’s a sports event what type of sport, if it’s an entertainment event what type of entertainment – e.g. boat show), as well as details about times, expected level of disruption, and so on.
For unplanned events, there are codes for a variety of types of events e.g. Spillages are divided into types like chemical, oil, and – unusually – “shed load”. Accidents are categorised into serious, multi-vehicle, vehicle fire, vehicle recovery, overturned vehicle, and so on. Other event codes include animals on road, people on road, obstructions, severe weather like fog, rain, snow, ice, high winds, etc. And loads more. And again, you get all the detail about times, level of disruption and so on.
For the variable message signs, you get the message text itself, the location of the sign, the source of the message (which authority set it), and so on. For the matrix signs, you get the code for the icon being displayed, the location of the sign, the time the message was set, etc.
 For the traffic data, you get data divided into monitored stretches of road. In the England data, there were tens of thousands of these road sections. For each stretch of road, you get:
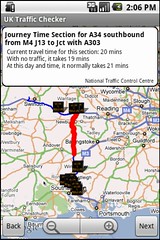
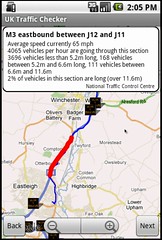
- current average travel times to traverse the section
- the typical travel for this stretch of road for this time and day of the week based on historical profiles
- the theoretical ideal travel time if there was no traffic
- the current average vehical flow rates (number of vehicles per hour) divided into the length of vehicle – how many vehicles shorter than 5.2m, how many vehicles between 5.2m and 6.6m in length, how many vehicles between 6.6m and 11.6m, and how many vehicles longer than 11.6m (the doc warns that “The accuracy of the loops when classifying vehicle lengths is 1% so measurements around each breakpoint could fall into adjacent categories” – like that’s a problem!)
- the current average vehicle speeds on the stretch of road
- the current average occupancy for the road
Not only was it detailed, but it was up-to-date. Data is updated at two-minute intervals if you pay for a premier account, or ten minute interals for the free standard account.
This was awesome. So much information!
The PDF documentation gives the URLs where the data is published. The data is behind HTTP basic authentication, so you need to request a username and password. (Slightly frustratingly, that page itself requires registration – you can create an account here to access the page to request an account to access the data).
But this is where it started getting complicated. The data is made available in XML files. One per data type – e.g. one for the traffic data, one for road works, one for variable message signs, and so on. But only one. You can’t get data for a particular road or part of the country. You can’t get just new data or data since a particular timestamp. You get it all. In one massive XML file.
Their servers reject any HTTP requests that don’t have gzip and deflate compression in the headers. This is presumably to keep their bandwidth costs down, as the XML files are pretty big! You get all the data for the whole country in one big lump.
And in an erratic order… you get a lump of XML in one bit of the file that tells you 12 vehicles between 6.6m and 11.6m long that been through a stretch of road in the last hour, but the bit of XML with the flow rate for vehicles longer than 11.6m on the same stretch of road will be in a completely different bit of the XML.
And with only very basic location information – you only get the lat/lon coordinates for the start and the end of any monitored stretch of road. Some of the sections are one motorway junction to the next, but some are very long. Check out this map to see a few examples of how the start and end points don’t really reflect the shape of the road. And the only way to tell you what the traffic is like where you are is to have a reliable way of knowing which road you are on, and how that relates to the monitored sections of road as identified by the NTCC.
And remember that there are tens of thousands of these stretches of road in England alone. While having lots of data was very cool, it’s also something of a headache.
And this is where I – finally! – get to what I did for my hack. The aim was to slice and dice this data, and make it available behind an API that a phone could use without needing to download and unzip 55MB of XML. 🙂
They do at least separate out the traffic data from the location information. Each item in the traffic data is identified by a road section name – e.g. “Section11260”. To find out where Section11260 is, you need to download another 25MB of gzipped XML in which you find that it is the A34 northbound from the junction with the A303 up to the M4, with the lat/lon coordinates for the start and end of this stretch.
This is good – these road sections wont change that often, so that’s a lot of data that you wont need to update frequently. And it makes the rest of the data a lot smaller by not duplicating descriptions of locations. But it also makes the traffic data a little anonymous without a little work.
This post is already far longer than I expected, so I’ll try and keep this brief. What I did was:
- Write some Java to download the locations data, unzip it, parse the XML using SAX, convert it into geometric shapes using functions in PostGIS and store it in a PostgreSQL table. Write some other Java to do the same with the traffic data XML and store it in other PostgreSQL tables.
- Set up a cron job so the traffic data tables are updated regularly
- Write a web service using a Java servlet running on Apache Tomcat which takes in start and end locations as a pair of lat/lon coordinates and:
- uses the Cloudmade routing API to turn the start and end points into a route (in KML form)
- uses a PostGIS function to turn that route into a geometric shape
- runs a PostgreSQL query using a few different PostGIS functions to search for which of the tens of thousands of monitored stretches of road are used by the route – including where the route only uses a part of the monitored section
- retrieves all of the traffic data, event and road sign items which are for those monitored stretches of road
- consolidates and converts all that traffic data into JSON giving the route annotated with traffic stats
Hmmm… put that like that it doesn’t look like it should’ve taken me so long, does it? In my defence, I was new to PostgreSQL and had big issues getting the JDBC drivers to play nicely so that I could query it from Tomcat 🙂
To demonstrate the point of creating this web service, I had to do a bit of Android coding.
I already had some Android code which takes a start and end named place from the user, converts them into lat/lons and calls a web service so this was a useful starter. That old code opened a dialog to display incidents from BBC Travel News as points on a map. That bit wasn’t reusable – the NTCC data refers to stretches of road rather than a single point. Plus I wanted to have a place to display the stats, as well as navigate through a route chopped up into sections.
So (with a bit of help!) I wrote a new Android activity that would display this route on a MapView, using back/next buttons to navigate through the different sections, and a TextView to display the stats in a floating panel at the top. I then made a little icon for variable message signs, and made a new overlay for all of them as points on the map. I also stuck the old BBC traffic alerts locations on as other points on the map, too – cos I had them from the old app anyway.
This turned out to be a massive pain – drawing long detailed routes on an Android MapView is hard. Make the route too detailed and your code throws OutOfMemory exceptions. Draw the path on every refresh and it’s insanely slow. But I managed to get something working in time for the demo. I would’ve liked more time to display the data in a more useful way, but ended up having to settle for just shoving it all on screen.
And that was the hack. If you want to know what percentage of vehicles on a section of road on your journey are longer than 11.6m, then:
a) you’re mad
b) this is how you can do it
Two final comments.
First – this hack won the prize for “Best use of Open APIs and Open Data” which was a lovely surprise. It also meant that I won a much appreciated Motorola DEXT. Yay.
Second – Several people have asked me when I’m going to publish this new app. The answer is…. erm… not sure. The problem isn’t the Android app – I could publish that today. The problem is the Tomcat and PostgreSQL bit. They are running on my laptop. That’s fine for a hackday demo, but not really a good long-term plan! I’d normally use Google App Engine for this sort of thing – free hosting of web services code. But they don’t support PostgreSQL.
And I don’t want to have to pay for a host that does, just so I can offer a free service (sorry if that sounds mean!).
So I’m trying to think of an alternative… if I think of one, I’ll definitely share the app. If you can think of a suitable host, please let me know.
Tags: data, datex, hackday, mobile, ntcc, open, ota10, overtheair, road, traffic
[…] Best use of Open APIs and Open Data – a Motorola DEXT – Dale Lane for UK Traffic […]
I completely agree about the electronic signs 😉
All very awesome, I think I’ll be looking at that data myself. I hope you find somewhere to do the postgres hosting.
Thanks. It’d be good if more people try doing something cool with it
I’ve talked to Ed about this before, and there is a lot of scope for interesting things to do with the data – such as the graphs of historical trends that he’s played with. I’m sure there are lots of other things I haven’t thought of, too
[…] use of Open APIs and Open Data : UK Traffic- Dale Lane A mashup of google maps with some publicly available but currently less than useful traffic data to […]
Fantastic article mate!
Looks like it could be a great app….any news on if you have progressed it?
eusty – Thanks very much.
Everything got a bit stalled while I waited for the okay from my employer (argh!) to be able to release this independently. I got that just before Christmas, but haven’t got round to actually looking for hosting of the server side stuff since getting approval.
I’ll start looking into it again now though
[…] have tinkered with writing my own feeds from NTCC data, which is something I’ve played with before. This is technically do-able – I’ve already written a basic PoC to demonstrate, but […]
[…] Dale Lane – Making National Traffic Control data more useful […]
[…] Best use of Open APIs and Open Data – a Motorola DEXT – Dale Lane for UK Traffic […]
[…] Best use of Open APIs and Open Data – a Motorola DEXT – Dale Lane for UK Traffic […]
[…] This was the fourth year I’ve been to OTA, and I normally submit some random hack. […]