or ‘my hack for Over The Air 2010’
 Yesterday was Over The Air 2010 – a very cool event for mobile developers, that really warrants a post to itself, but I’m too tired so that will have to wait for another day.
But while I was there, I had a go at the hack challenge. I’m pleased that there was a fair amount of interest in what I did, so in this post, I want to share some of the technical details.
The hack centred around getting access to (pseudo-)realtime data about UK roads. It turns out that there is an effort to make traffic and road monitoring data available in a consistent, interchangeable format: DATEX II.
The DATEX site has a list of documentation for the traffic data made available for England, Scotland, Sweden, Italy, Spain, Portugal, Netherlands, and regions in France and Germany. For a data geek, this was quite a cool find 🙂
I only had 24 hours to play, so started with the data available for England – covering the motorway and trunk roads. The web page includes a 39-page PDF which documents the data that the National Traffic Control Centre publishes for England.
The nice thing about DATEX II being an agreed standard is that although I spent the evening working with the English traffic data, once the code was done, there wouldn’t be anything to stop me using the same code with the Scottish data too.
They publish a lot of data – more than I realised was being collected, let alone made publicly available. This chimed well with the keynote on Saturday morning by the brilliant Tim Berners-Lee, in which he talked about the importance of publicly available data.
The data includes:
- current and future planned roadworks
- current and future planned events expected to affect traffic
- unplanned events affecting traffic
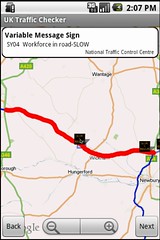
- the current message being displayed on variable message signs (the electronic traffic signs that can be set to display text messages like “don’t drink and drive”)
- the current graphic being displayed on matrix signs (those square electronic displays that can display icons like which motorway lanes are closed)
- information about traffic on monitored stretches of road
This was an impressive list – is it just me, or is the ability to find out what is currently written on the electronic sign hanging over every major road in the country seriously cool? No? Okay… so I’m a geek. 🙂
But beyond the list, what was impressive was the amount of detail.
 For roadworks, you can find out not only where they are, but what type of roadworks they are – e.g. resurfacing, barrier repairs, bridge repairs, etc., what times of day they will be active, when they are expected to finish, the anticipated level of disruption, number of lanes to be closed, and much more.
For events, you can find out the type of event (e.g. if it’s a sports event what type of sport, if it’s an entertainment event what type of entertainment – e.g. boat show), as well as details about times, expected level of disruption, and so on.
For unplanned events, there are codes for a variety of types of events e.g. Spillages are divided into types like chemical, oil, and – unusually – “shed load”. Accidents are categorised into serious, multi-vehicle, vehicle fire, vehicle recovery, overturned vehicle, and so on. Other event codes include animals on road, people on road, obstructions, severe weather like fog, rain, snow, ice, high winds, etc. And loads more. And again, you get all the detail about times, level of disruption and so on.
For the variable message signs, you get the message text itself, the location of the sign, the source of the message (which authority set it), and so on. For the matrix signs, you get the code for the icon being displayed, the location of the sign, the time the message was set, etc.
 For the traffic data, you get data divided into monitored stretches of road. In the England data, there were tens of thousands of these road sections. For each stretch of road, you get:
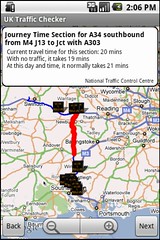
- current average travel times to traverse the section
- the typical travel for this stretch of road for this time and day of the week based on historical profiles
- the theoretical ideal travel time if there was no traffic
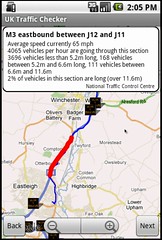
- the current average vehical flow rates (number of vehicles per hour) divided into the length of vehicle – how many vehicles shorter than 5.2m, how many vehicles between 5.2m and 6.6m in length, how many vehicles between 6.6m and 11.6m, and how many vehicles longer than 11.6m (the doc warns that “The accuracy of the loops when classifying vehicle lengths is 1% so measurements around each breakpoint could fall into adjacent categories” – like that’s a problem!)
- the current average vehicle speeds on the stretch of road
- the current average occupancy for the road
Not only was it detailed, but it was up-to-date. Data is updated at two-minute intervals if you pay for a premier account, or ten minute interals for the free standard account.
This was awesome. So much information!