Archive for February, 2010

Why I haven’t written TwitToday for Android

Thursday, February 25th, 2010

(or “looking at the limitations of the Android home screen widgets framework”)

Twitter client for Windows MobileA couple of years ago, I wrote a Windows Mobile app called TwitToday : a Twitter widget for the “Today screen” (the default screen when the phone is on, with all apps closed or minimised).

The rationale was that it was useful to have a way to post a tweet quickly when you don’t want to have to wait for a full-blown client to start.

Or if you don’t want to incur the battery or memory cost of leaving a client running all the time.
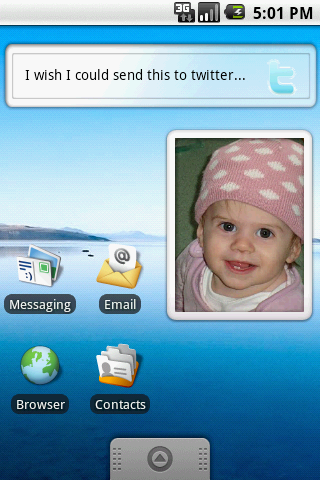

A widget that doesn't work on AndroidAndroid has a “Home screen”, which is similar to the Today screen on Windows Mobile. And it has support for widgets. This led several people to ask me why I never ported TwitToday to Android.

The short answer is that I did try, but the current state of the widgets framework made it impossible.

I tried to write a TwitToday widget back when the Android widgets framework was first introduced in Android 1.5.

It all started quite well:

  1. I wrote the Android Service that would carry out the background task of posting a tweet. No problems there – it worked fine.
  2. I wrote the widget XML to define the GUI. This is what you can see running in the screenshot. And it works… sort of. It has a text box that you can type up to 140 characters into. And if you press the button, it causes a chunk of code to get invoked.

The problem came when I tried to link the two together: to get the Service that posts tweets to obtain the String from the text box in my widget.

This isn’t possible. Android’s widget framework as it currently stands is geared around displaying information to the user, not collecting user input.
(more…)

Using my mobile as a TV remote control for vdr

Monday, February 22nd, 2010

remote controlsI can never find the TV remote.

Whether it’s slipped somewhere in or under the sofa, or been hidden by the kids, I’m often at a loss to find it.

A mobile phone, on the other hand, is rarely too far from my hand 🙂

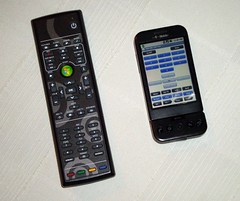
So I’ve hacked together a quick app to put a TV remote control interface on my phone. It’s definitely a quick-and-dirty chunk of code, but it does now mean that I can work my TV from my mobile if I can’t find the real remote.

On the off-chance that this is useful to other vdr users, I wanted to share how I did it.

(more…)

What do I do at work?

Sunday, February 21st, 2010

I’ve been an Emerging Technologies Specialist for about a year and a half now. As I mentioned when I got the job, I don’t know of anywhere that I can point people at that explains what my team do.

I’ve been wary of filling this gap myself, partly because the work that the team does is so diverse that I’m not going to do us justice. But, allowing for the fact that I’ll miss a ton of cool stuff that my colleagues do, I figure that I should try and describe what I do.

I work in the Emerging Technology Services team.

How to explain this?

(more…)

Why I use vdr for TV

Thursday, February 11th, 2010

Both here and on twitter, I’ve mentioned a few of the things I’ve done with my vdr-based media computer. In this post, I want to quickly take a step back and explain what made me go for this setup in the first place.

By way of quick background, we’ve now got an Asrock Ion 330 living under the TV as a set-top box, connected to the TV via an HDMI cable, and receiving a digital freeview signal over USB from the twin tuners in a Sony Play-TV. It’s quiet, has reasonably low power requirements, is small and pretty, can be controlled by a remote control using a small infra-red receiver plugged into a USB port, and has plenty of storage between it’s own hard-drive and the 500 GB on the Western Digital My Book attached over USB.

This isn’t a “why I use vdr instead of MythTV (or any other open-source HTPC software” post. Mainly because I don’t know enough about the alternatives to talk about them intelligently.

Instead, I wanted to explain why I went for setting up a Linux computer with a TV card instead of just buying another set-top box appliance when ours died last year. It’s not as simple (set-top boxes pretty much set themselves up nowadays) and certainly wasn’t cheaper (largely because I was starting from scratch – if I already had a server to use, that’d be different). So what was the incentive?

(more…)

Book review: Matplotlib for Python Developers

Thursday, February 11th, 2010

Matplotlib for Python Developers, Sandro Tosi

Let me get the boring disclaimer-y bit out of the way first: I didn’t buy this book – Packt Publishing sent me a free copy in return for me writing a review of it. They’ve not made any specific requests about the contents of my review, just that I should write a review. And, in fact, I should give them props for not hassling me for not getting around to writing this until now – about eight weeks after they sent it. So either they forgot they sent it to me, or they are terribly patient. I’m choosing to assume it’s the latter 🙂

With that out of the way… matplotlib is a graphing library. I’ve used it a lot for my CurrentCost energy monitoring app – all of the graphs in the app are created using matplotlib. And while it is very powerful, it can be a little tricky to get your head around. I still struggle with getting the graphs exactly how I want them even now.

That was why I agreed to do this review – I liked the sound of the book and thought it’d be useful for me.

Overall, it’s a really good book. It starts off going through all the basics, both in terms of explaining the ideas and concepts, and in the practical steps needed to get set up. I’m not normally a big fan of reading text books, preferring to figure stuff out for myself as I go along, but found that even here I picked up tips that I never knew and subtle features that I’d missed.

A nice flow-chart kicks off the detail into producing different types of graphs and chart. It starts from asking “What would you like to show?” (e.g. comparison; distribution; composition; relationship; etc.).

Following this through for what you want to show, and what type of data you have, leads you to a suggestion for the type of graph that is most appropriate for your needs (e.g. line histogram; waterfall chart; pie chart; stacked column chart; scatter chart; etc.). For someone like me who doesn’t have the world’s strongest maths background, this was a really useful guide.

(more…)