In this post, I want to share a new feature in the generative AI support in Machine Learning for Kids: tool calling.
I wrote last year about how I introduced Generative AI in Machine Learning for Kids by adding support for projects using small language models. And earlier this year, I walked through my six favourite projects for explaining different aspects of Gen AI.
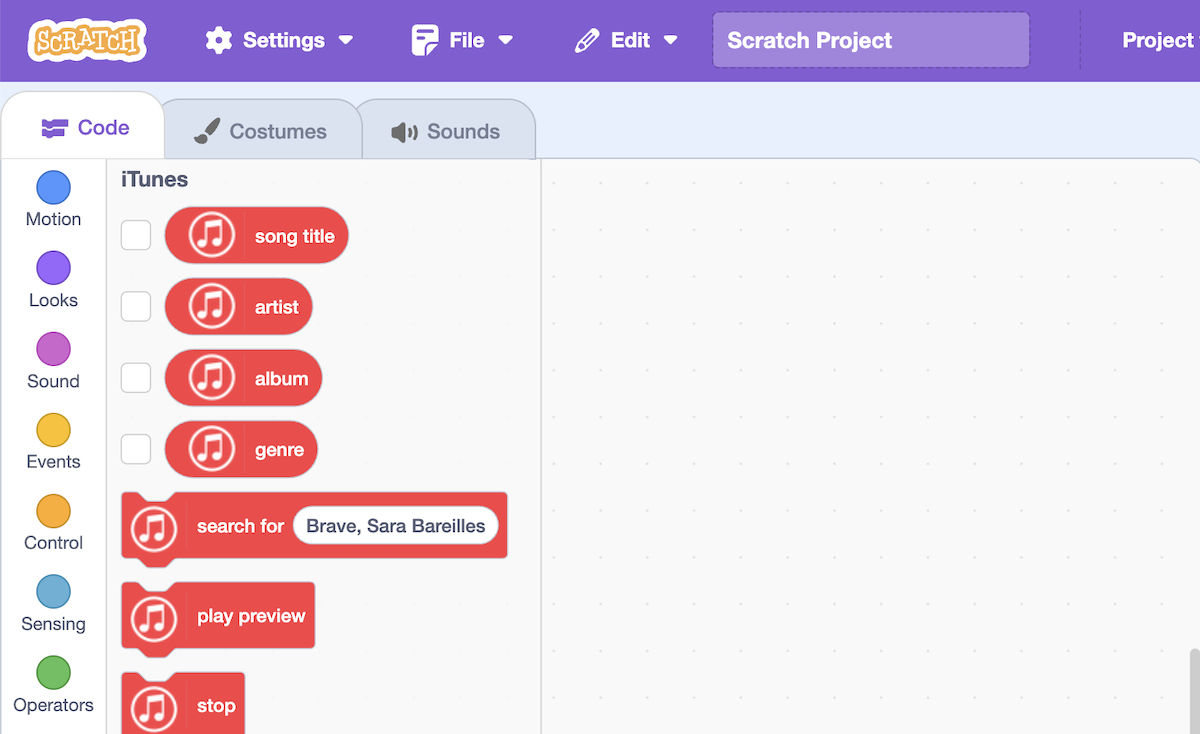
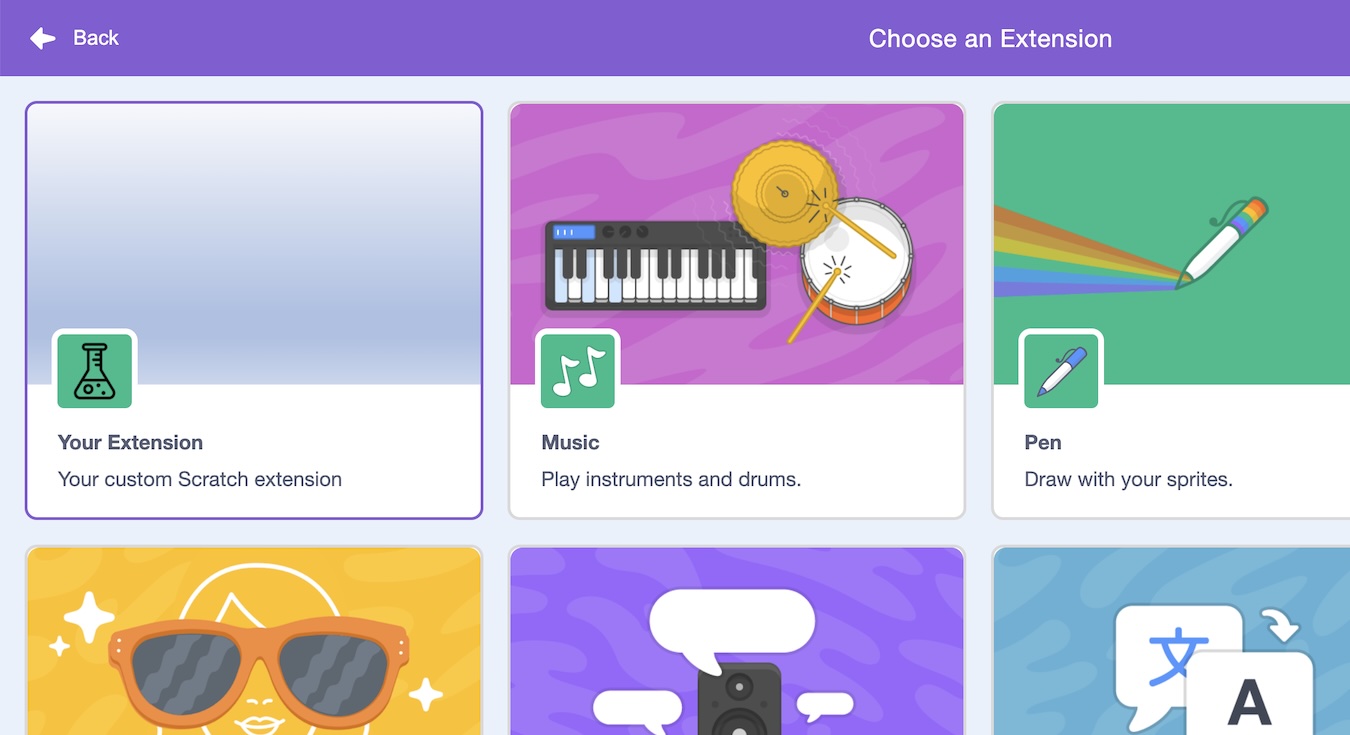
This week I’ve been working on extending the language model support in the site, by adding a new model that is capable of tool calling.
demo video at youtu.be/HdcTseNvjhU
Why is tool calling useful?
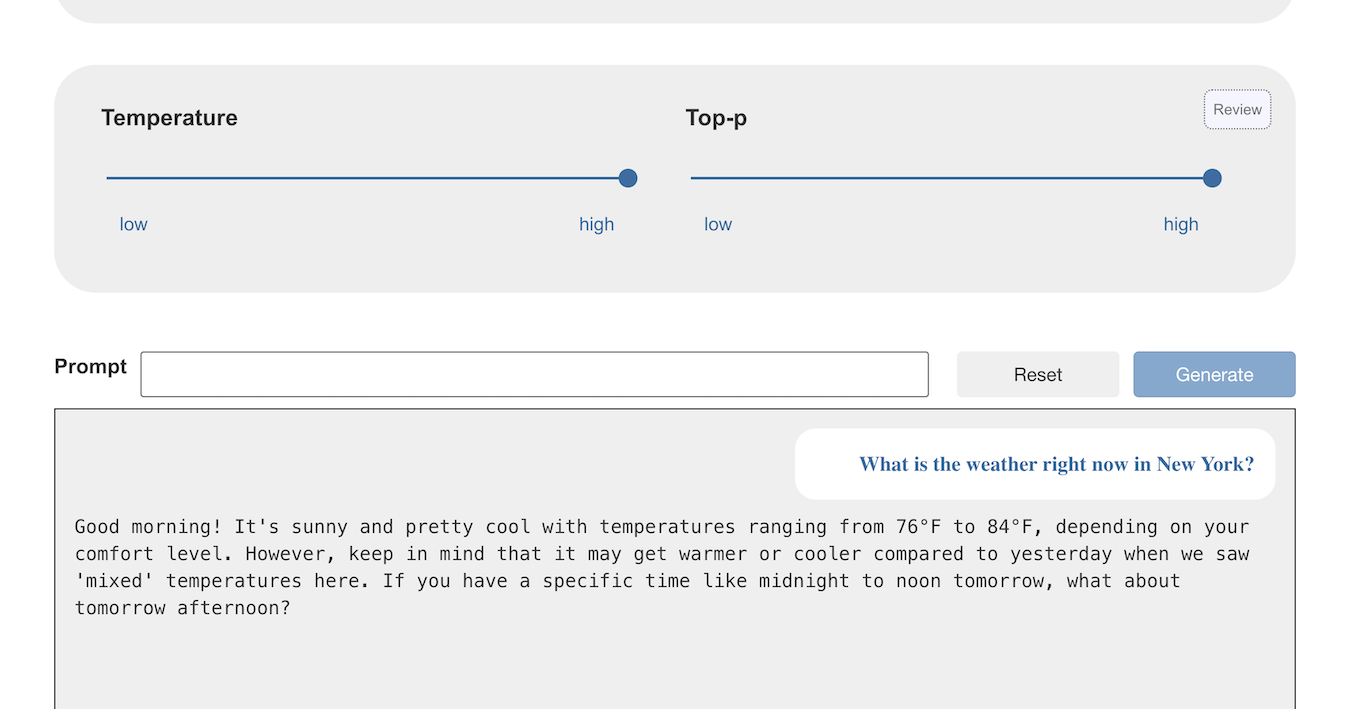
Try asking a model what the weather is like in New York right now.
If the temperature and top-p is high enough, many of the models will likely hallucinate an answer.
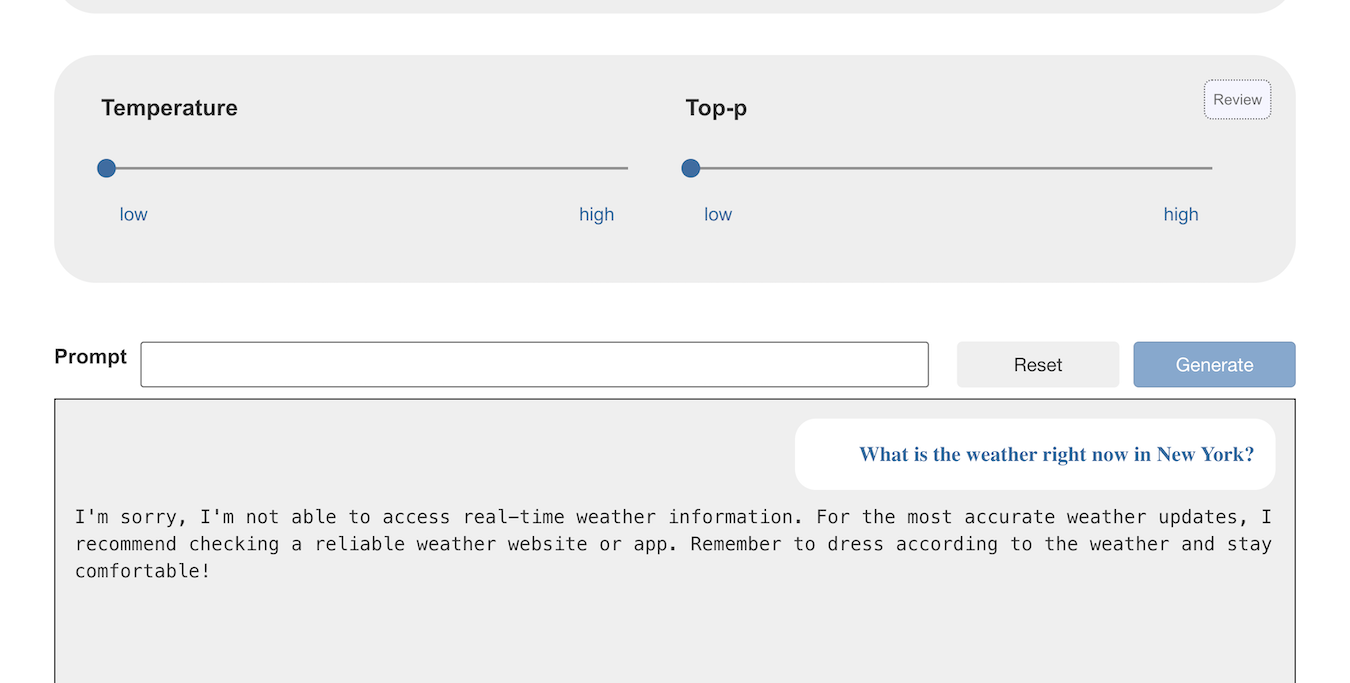
If the temperature and top-p is low enough, the models can just respond that they cannot answer that.
(If you don’t know why “temperature” makes that difference, I’ve written about that before and have a student worksheet that focuses on this.)
This second answer is more accurate at least, but it is still not helpful. The point is, if you ask the model for something that can’t possibly be represented in the knowledge used to create it, the model cannot give a helpful answer by itself.
Tool calling helps in these situations by making tools available to the model. It can call these tools to help respond to prompts that can’t be answered by the model alone.