When using Apache Kafka, timely processing of events is an important consideration.
Understanding the throughput of your event processing solution is typically straightforward : by counting how many events you can process a second.
Understanding latency (how long it takes from when an event is first emitted, to when it has finished being processed and an action has been taken in response) requires more coordination to be able to measure.
OpenTelemetry helps with this, by collecting and correlating information from the different components that are producing and consuming events.
From opentelemetry.io:
OpenTelemetry is a collection of APIs, SDKs, and tools. Use it to instrument, generate, collect, and export telemetry data (metrics, logs, and traces) to help you analyze your software’s performance and behavior.
A distributed event processing solution
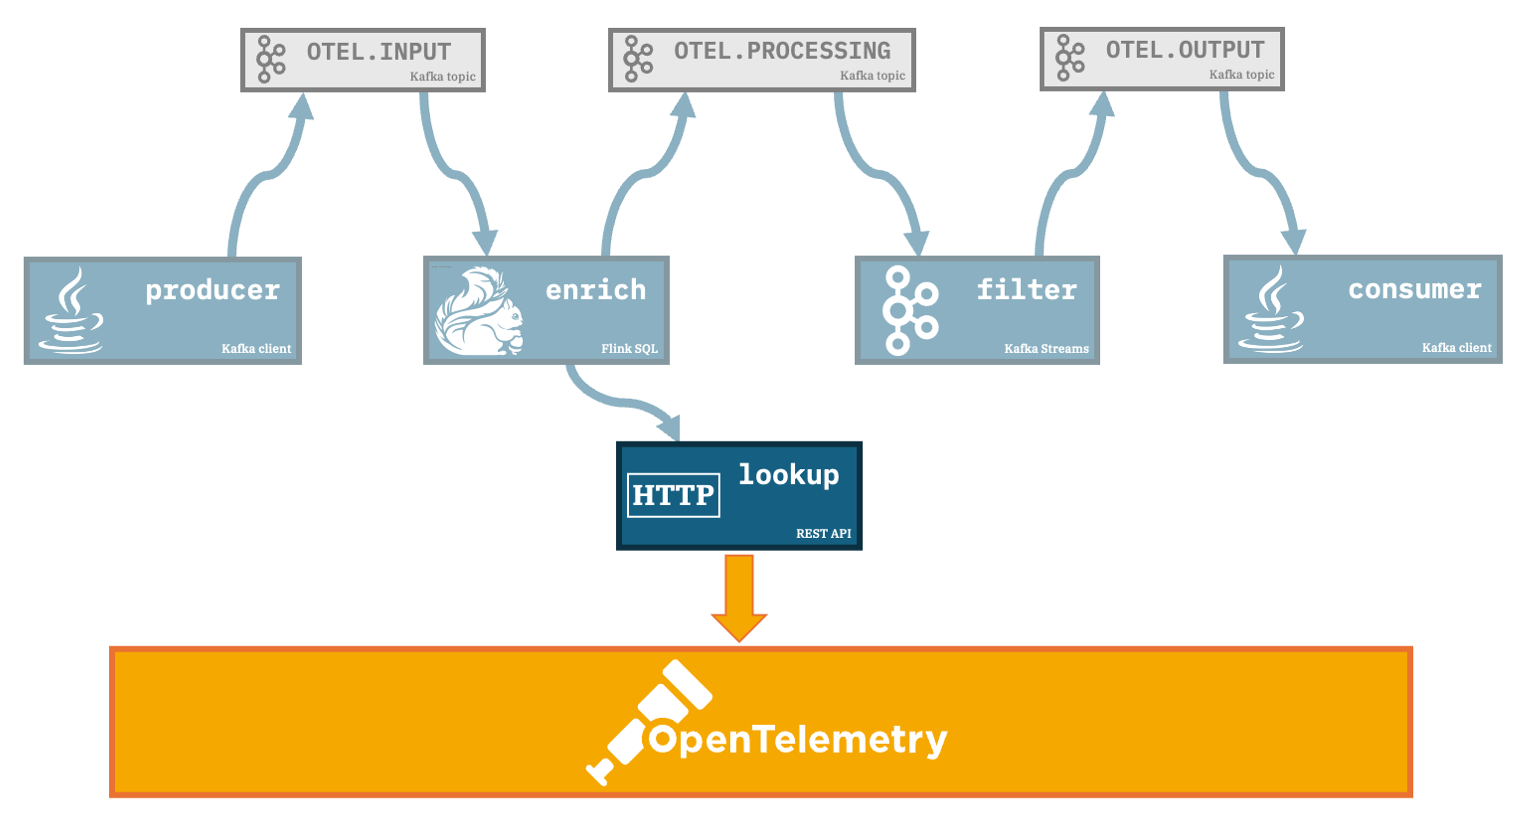
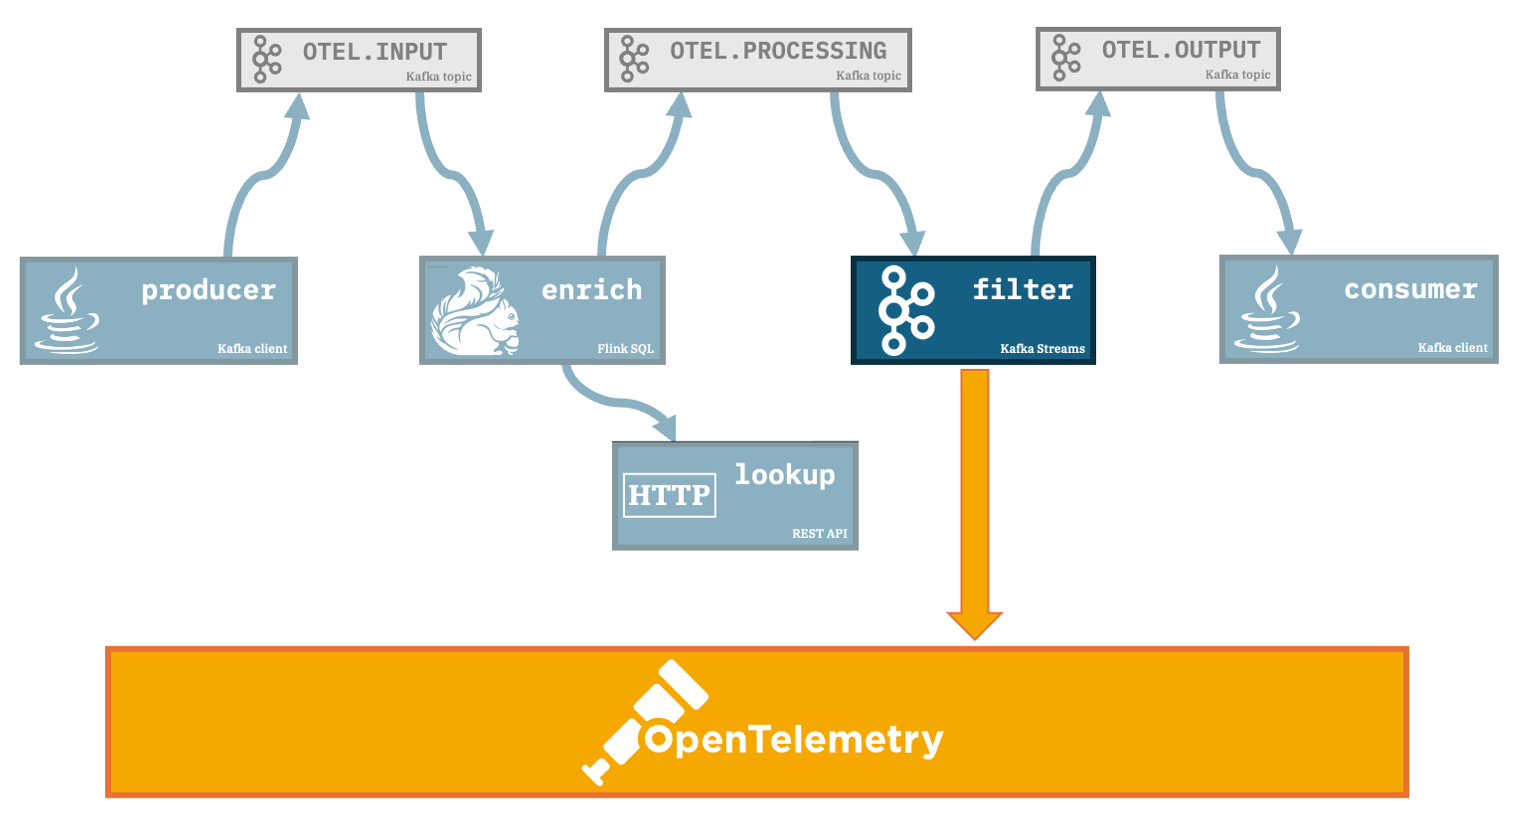
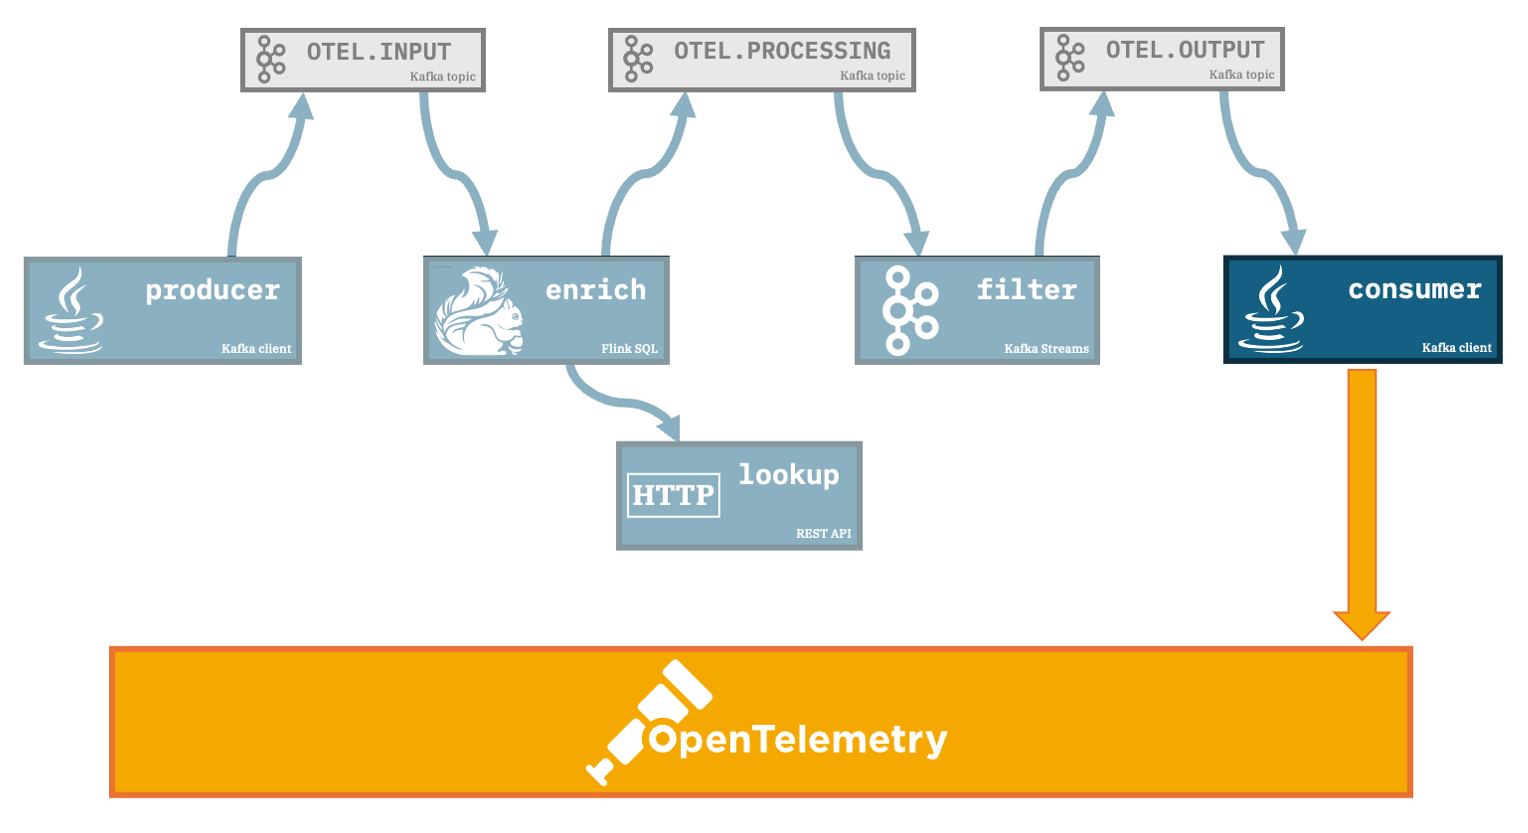
To understand what is possible, I’ll use a simple (if contrived!) example of an event processing architecture.
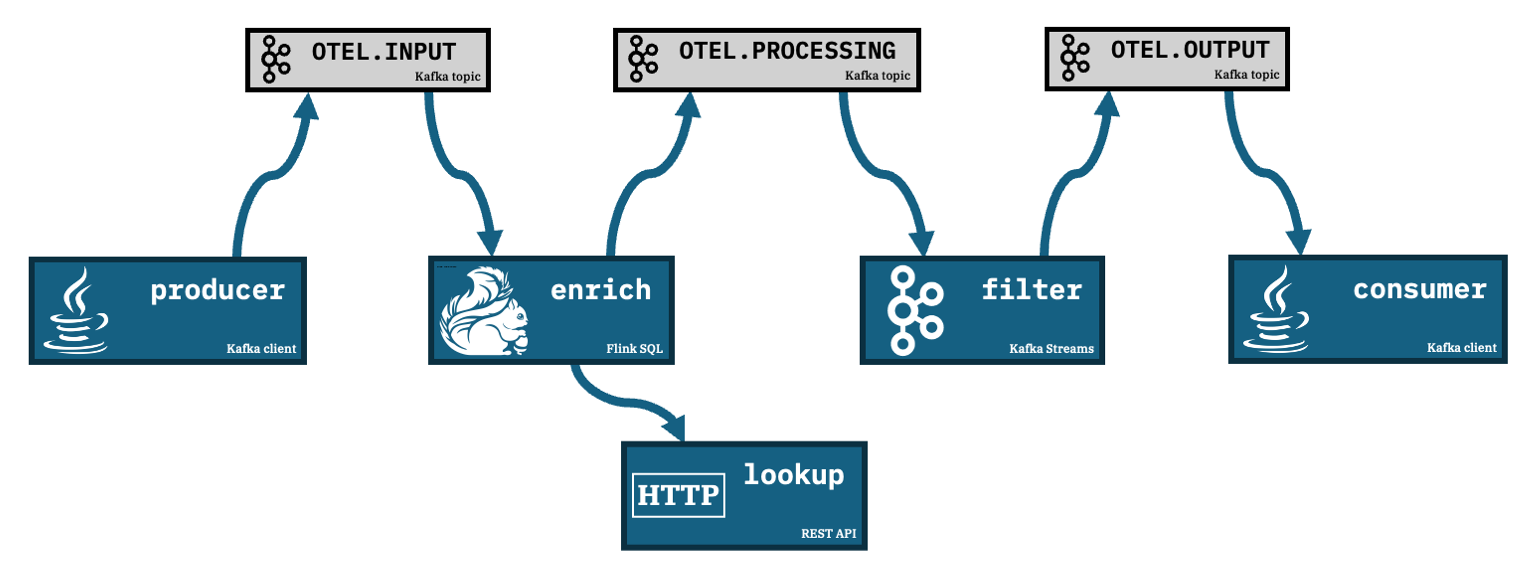
In this demo:
producer
A Java application reads JSON files in a folder, and produces the contents of each file as an event to a Kafka topic calledOTEL.INPUTenrich
A Flink SQL job consumes the events fromOTEL.INPUT, enriches each event with additional data it retrieves from a REST API, and produces the output to a Kafka topic calledOTEL.PROCESSINGfilter
A Kafka Streams application consumes events from theOTEL.PROCESSINGtopic, applies a filter and produces matching events to a Kafka topic calledOTEL.OUTPUTconsumer
A Java application consumes events from theOTEL.OUTPUTKafka topic and prints the contents to the console
Understanding the behaviour
A simple understanding of the latency for this solution means understanding how long it takes from when producer sends the file contents to the OTEL.INPUT topic, to when consumer prints out the results from processing it.
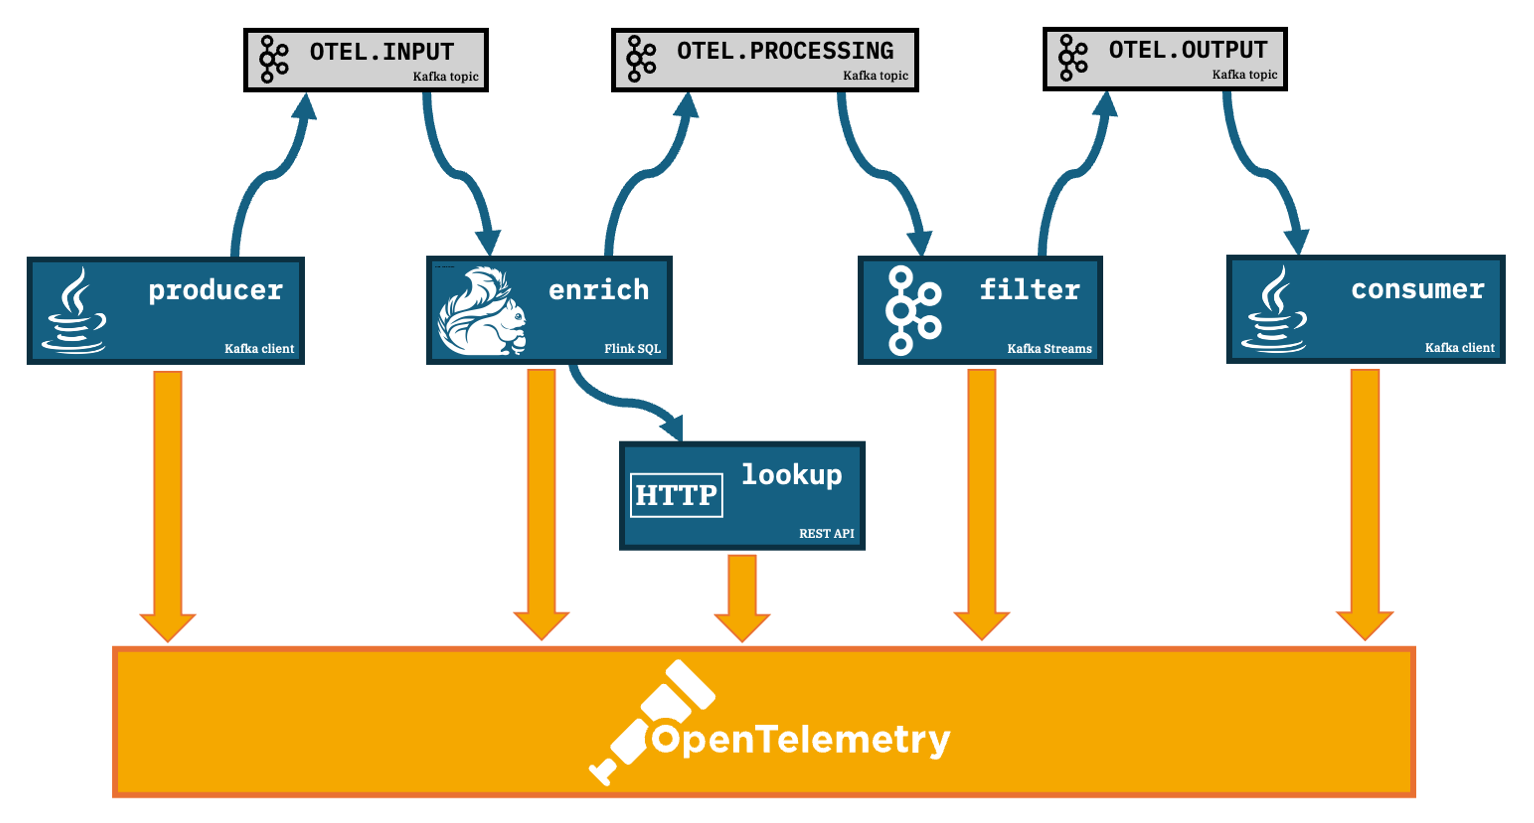
A detailed insight into the performance of this solution means understanding the time spent by each of the parts of the solution.
Instrumenting each of the components lets them independently submit “spans” (recordings of what they did and when) to an OpenTelemetry collector. The collector correlates the spans it receives into end-to-end traces.
Deploying the OpenTelemetry collector
OpenTelemetry is the specification and protocol for how to do all of this, and there are several implementations available.
For my demo, I used Grafana Tempo, because there is a Kubernetes Operator that made it very easy to create a quick demo.
apiVersion: tempo.grafana.com/v1alpha1
kind: TempoMonolithic
metadata:
  name: otel
  namespace: monitoring
spec:
  jaegerui:
    enabled: true
    resources:
      limits:
        cpu: '2'
        memory: 2Gi
    route:
      enabled: true
  resources:
    limits:
      cpu: '2'
      memory: 2Gi
  storage:
    traces:
      backend: memory
There are many alternative OpenTelemetry implementations that I could have used instead. You can see a list on the OpenTelemetry website at opentelemetry.io/ecosystem/vendors
Instrumenting the producer
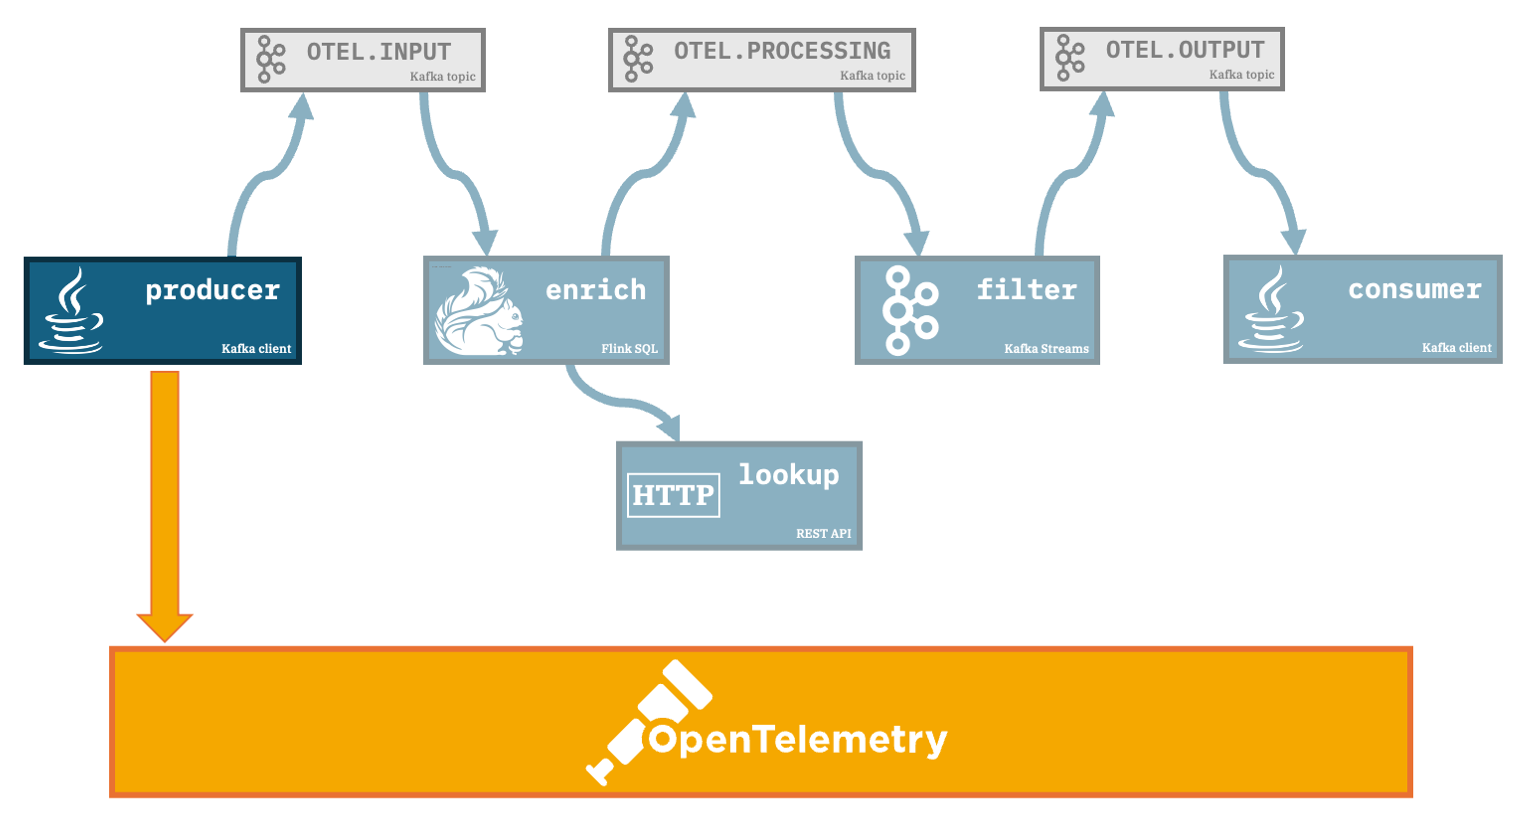
The producer application uses the Kafka Java client to send events to Kafka.
No code changes were needed to get it to submit trace spans to the OpenTelemetry collector, but a few config changes were needed. You can see them in this commit, but I’ll walk through them here.
The simplest way to add the additional Java libraries needed was to get Maven to fetch them for me, by adding this to the dependencies list in my pom.xml
<dependency>
    <groupId>io.opentelemetry.instrumentation</groupId>
    <artifactId>opentelemetry-kafka-clients-2.6</artifactId>
    <version>2.11.0-alpha</version>
</dependency>
I updated the properties file that is used to configure the Kafka Producer by adding this line:
interceptor.classes=io.opentelemetry.instrumentation.kafkaclients.v2_6.TracingProducerInterceptor
Finally I updated the script used to run the application to add a Java agent and environment variables that configure:
- how the producer should identify itself in the traces
- what should be submitted to OpenTelemetry (OTel can be used to collect metrics and logs as well as traces – for this demo, I only want traces)
- where to submit the traces
export OTEL_SERVICE_NAME=demo-producer

export OTEL_TRACES_EXPORTER=otlp
export OTEL_METRICS_EXPORTER=none
export OTEL_LOGS_EXPORTER=none

export OTEL_EXPORTER_OTLP_ENDPOINT=http://$(oc get route -nmonitoring tempo-otel-http -ojsonpath='{.spec.host}')

java \
    -javaagent:$(pwd)/opentelemetry-javaagent.jar \
    -cp ./target/sample-kafka-apps-0.0.5-jar-with-dependencies.jar \
    com.ibm.eventautomation.demos.producers.JsonProducer
Instrumenting Apache Flink
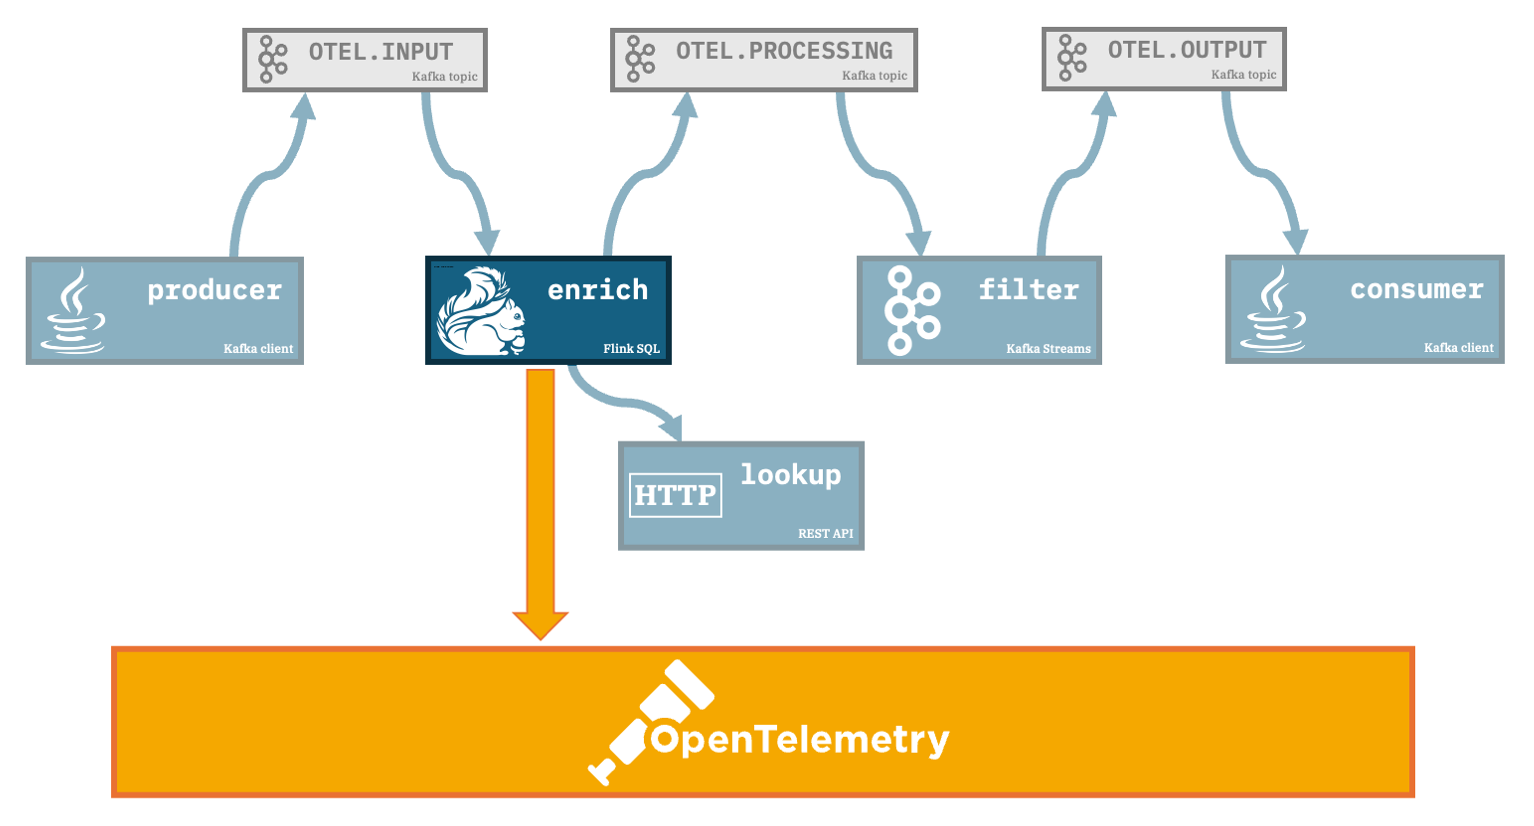
The enrich component is a Apache Flink SQL job, running in a Flink Session cluster managed by a Kubernetes Operator.
I made a few small changes to the SQL, and updated the way the job is deployed and run.
The simplest way to add the additional Java libraries needed was to download them (download-jars.sh) and then build them (build-and-push.sh) into a custom container image:
FROM <my-standard-flink-image>:<my-flink-version>

COPY opentelemetry-javaagent.jar /opt/flink/lib/
COPY target/dependencies/*.jar   /opt/flink/lib/
The properties for the Kafka consumer and producer used by Flink are provided as part of the SQL table definitions for the source and sink tables, so I updated them by adding these lines:
# source node

CREATE TABLE INPUT__TABLE
(
    ...
    # get access to the headers in the consumed Kafka messages
    INPUT___KAFKA_HEADERS MAP<STRING, STRING> METADATA FROM 'headers',
)
WITH
(
    ...
    # add the OTel support to the Kafka consumer used by Flink
    'properties.interceptor.classes' = 'io.opentelemetry.instrumentation.kafkaclients.v2_6.TracingConsumerInterceptor'
);

CREATE TEMPORARY VIEW INPUT AS
SELECT
    ...
    # extracting trace context identifier from the headers
    INPUT___KAFKA_HEADERS ['traceparent'] AS `traceparent`
FROM
    INPUT__TABLE;
# sink node

CREATE TEMPORARY VIEW TRANSFORM AS
SELECT
    ...
    # prepare the trace context for the output Kafka events
    MAP[ 'traceparent', traceparent ] AS `headers`
FROM
    ...

CREATE TABLE OUTPUT
(
    ...
    # add the trace context to the headers for the output Kafka events
    headers MAP<STRING, STRING> METADATA
)
WITH
(
    ...
    # add the OTel support to the Kafka producer used by Flink
    'properties.interceptor.classes' = 'io.opentelemetry.instrumentation.kafkaclients.v2_6.TracingProducerInterceptor'
);
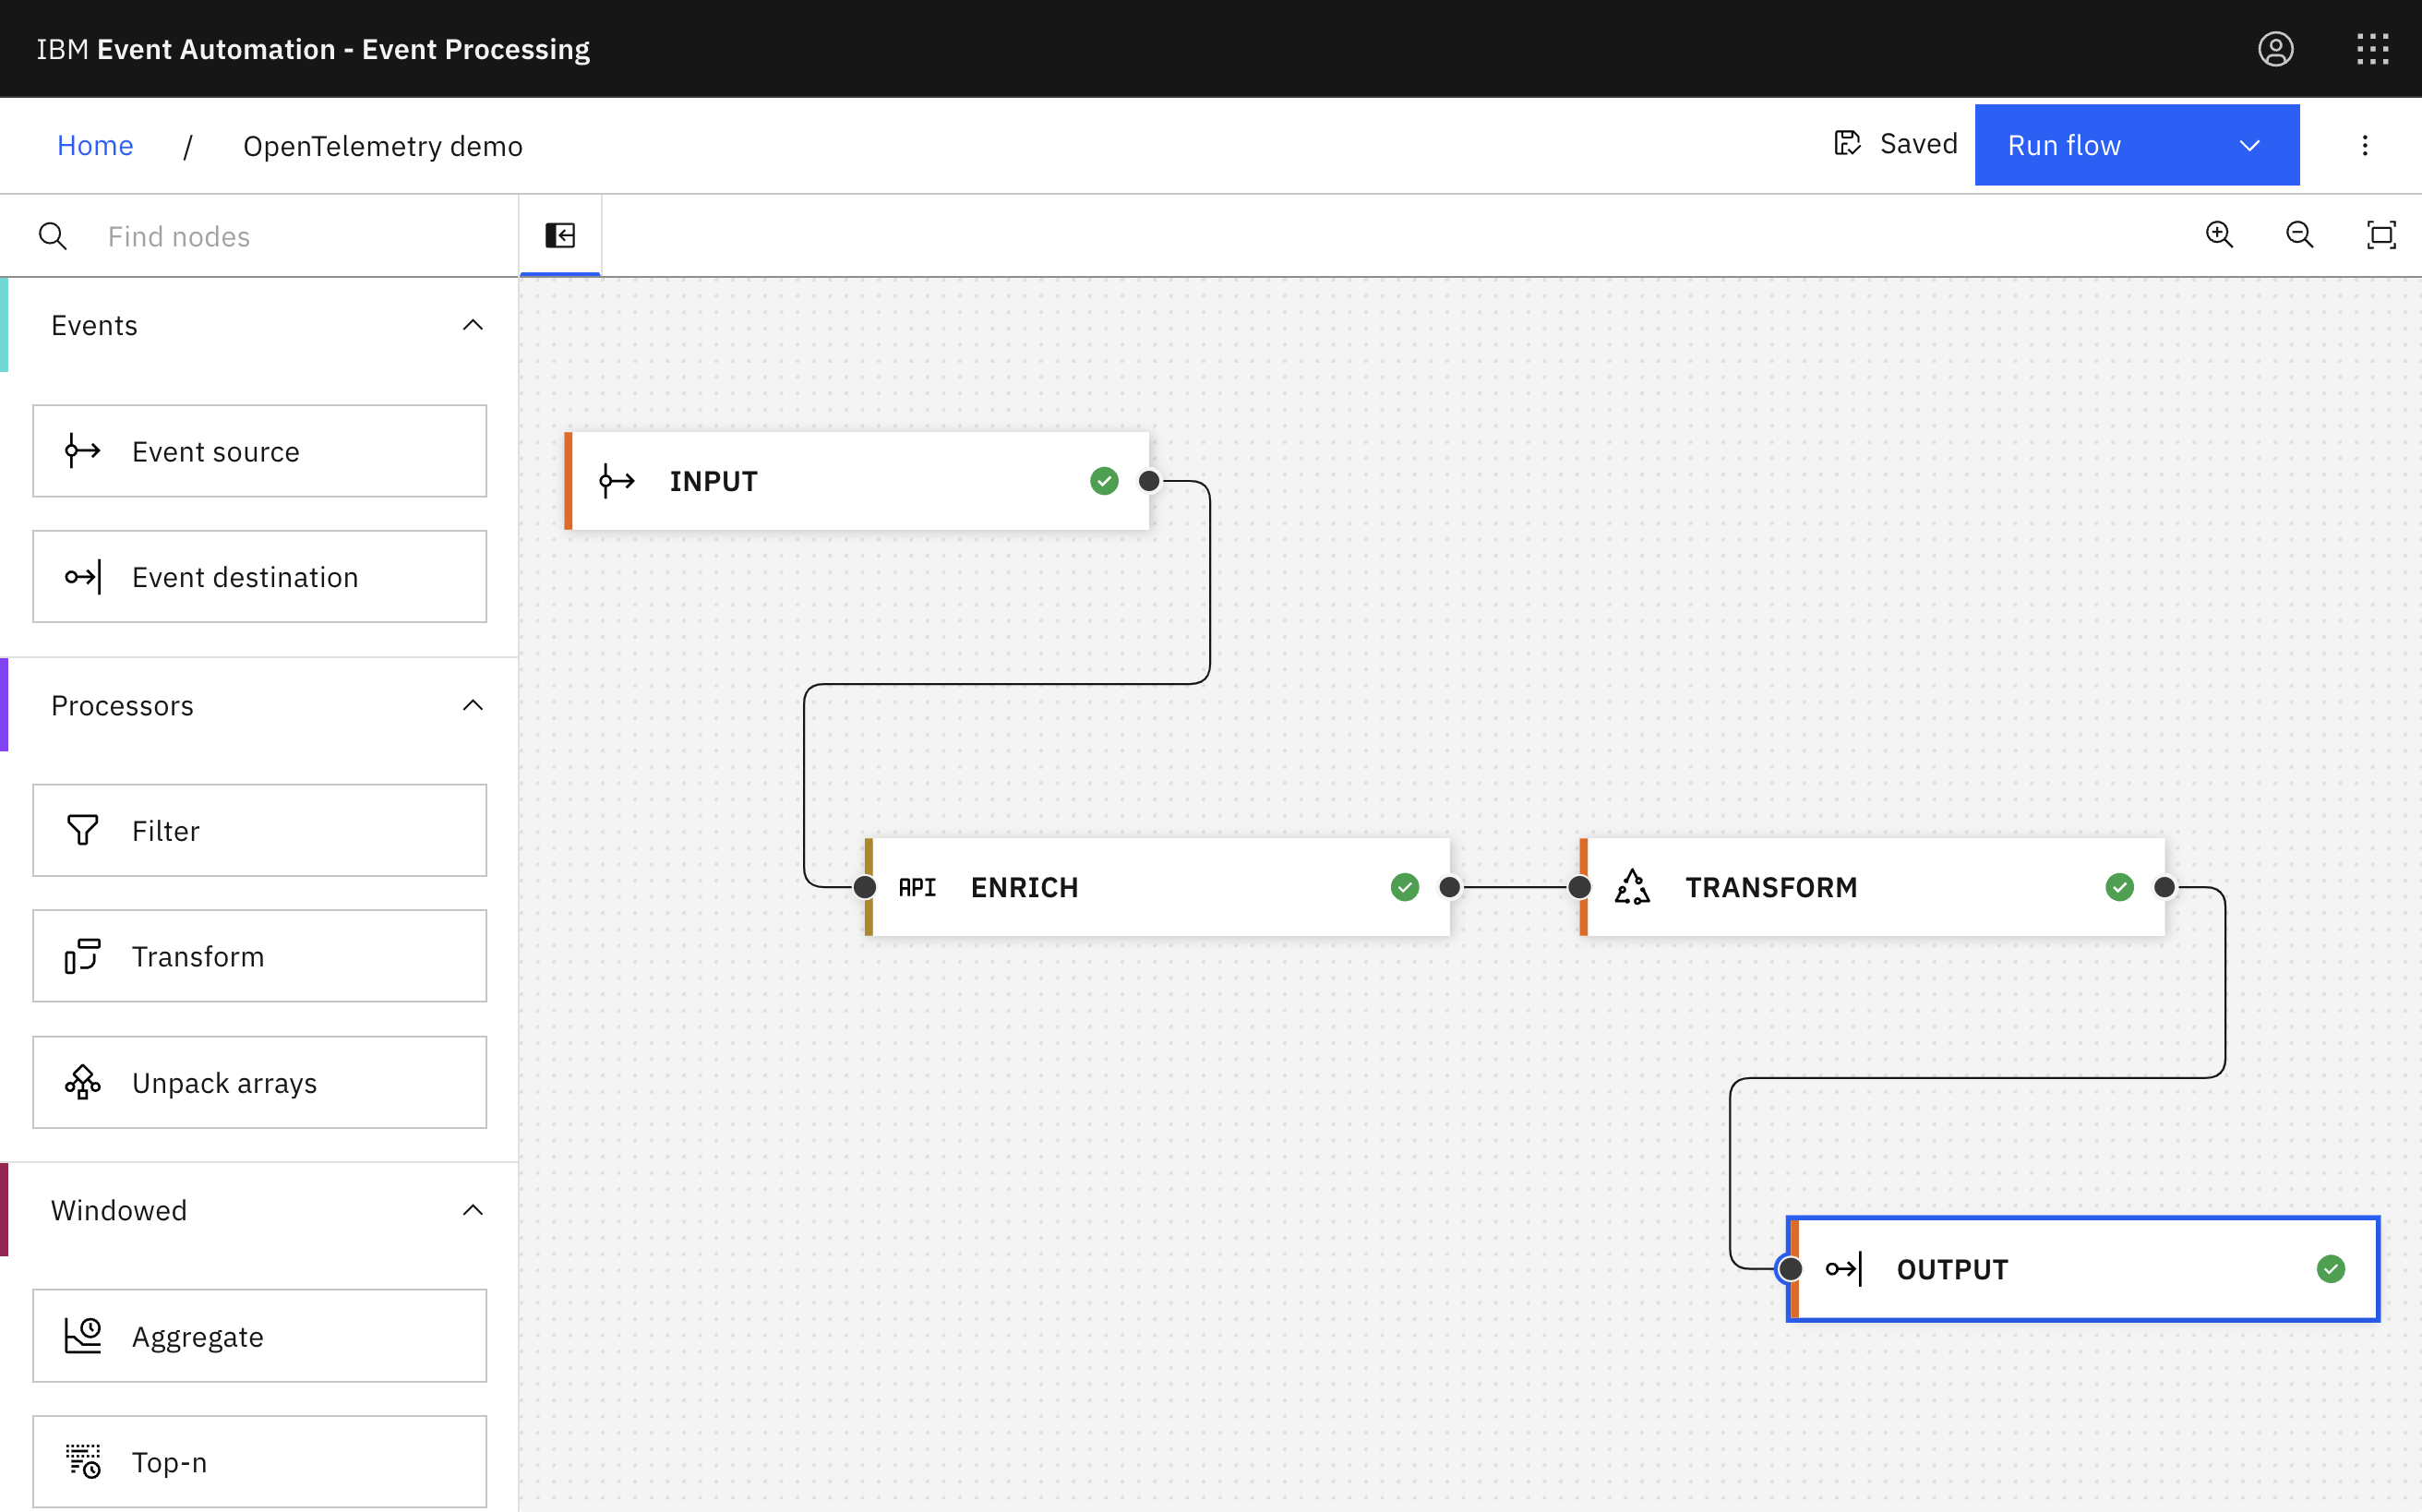
I used the Event Processing UI to create the Flink job, but I could equally well have written the Flink SQL for myself. The changes above are the overrides I needed to add to the default SQL that the low-code UI generated.
Finally I updated the Kubernetes custom resource used to deploy the Flink session cluster to configure:
- how Flink should identify itself in the traces
- what should be submitted to OpenTelemetry (OpenTelemetry can be used to collect metrics and logs as well as traces – for this demo, I only want traces)
- where to submit the traces
- the custom container image to use, with the Java agent
These are the changes I made to my Flink deployment to add the OpenTelemetry support:
apiVersion: flink.apache.org/v1beta1
kind: FlinkDeployment
metadata:
  name: my-flink
  namespace: event-automation
spec:
  # custom container image with the additional OpenTelemetry dependencies
  image: 'image-registry.openshift-image-registry.svc:5000/event-automation/flink-opentelemetry:1'

  # use the OpenTelemetry agent
  flinkConfiguration:
    env.java.opts.taskmanager: '-javaagent:lib/opentelemetry-javaagent.jar'
    env.java.opts.jobmanager: '-javaagent:lib/opentelemetry-javaagent.jar'

  # environment variables to configure what to submit to OTel and where
  podTemplate:
    spec:
      containers:
        - env:
            - name: OTEL_SERVICE_NAME
              value: flink
            - name: OTEL_TRACES_EXPORTER
              value: otlp
            - name: OTEL_METRICS_EXPORTER
              value: none
            - name: OTEL_LOGS_EXPORTER
              value: none
            - name: OTEL_EXPORTER_OTLP_ENDPOINT
              value: http://tempo-otel.monitoring:4318
          name: flink-main-container
Instrumenting the REST API
The lookup REST API that the Flink job uses to enrich the events is running in an OpenLiberty server.
No code changes were needed to get it to submit trace spans to the OpenTelemetry collector, but a few config changes were needed. You can see them in this commit, but I’ll walk through them here.
The simplest way to instrument this was to add the telemetry feature to the server.xml, and configure it to specify what to submit to OpenTelemetry. (OpenTelemetry can be used to collect metrics and logs as well as traces – for this demo, I only want traces):
<server>
    <featureManager>
        ...
        <!-- enable OpenTelemetry support -->
        <feature>mpTelemetry-2.0</feature>
    </featureManager>

    <!-- submit traces to OpenTelemetry collector -->
    <mpTelemetry
        source="trace"/>
</server>
I configured OpenTelemetry with details of where to send the traces by adding this to bootstrap.properties. As I’m running the Liberty server in Kubernetes, the simplest way to do this was by putting it in a Secret and mounting it into the Liberty deployment.
kind: Secret
apiVersion: v1
metadata:
  name: loosehangerapi-otel
type: Opaque
stringData:
  bootstrap.properties: |+
    otel.sdk.disabled=false
    otel.service.name=loosehanger-api
    otel.exporter.otlp.endpoint=http://tempo-otel.monitoring:4317
    otel.traces.exporter=otlp
    otel.metrics.exporter=none
    otel.logs.exporter=none
---
apiVersion: apps/v1
kind: Deployment
metadata:
  name: loosehanger-api
  ...
spec:
  template:
    spec:
      containers:
      - name: apiserver
        ...
        volumeMounts:
          - name: loosehangerapi-otel
            mountPath: /opt/ol/wlp/usr/servers/defaultServer/bootstrap.properties
            subPath: bootstrap.properties
            readOnly: true
      volumes:
        - name: loosehangerapi-otel
          secret:
            secretName: loosehangerapi-otel
Instrumenting Kafka Streams
The filter application uses Kafka Streams to produce a subset of the input events.
No code changes were needed to get it to submit trace spans to the OpenTelemetry collector, but a few config changes were needed. You can see them in this commit, but I’ll walk through them here.
The simplest way to add the additional Java libraries needed was to get Maven to fetch them for me, by adding this to the dependencies list in my pom.xml
<dependency>
    <groupId>io.opentelemetry.instrumentation</groupId>
    <artifactId>opentelemetry-kafka-clients-2.6</artifactId>
    <version>2.11.0-alpha</version>
</dependency>
I updated the properties file that is used to configure the Kafka Streams application by adding these lines:
consumer.interceptor.classes=io.opentelemetry.instrumentation.kafkaclients.v2_6.TracingConsumerInterceptor
producer.interceptor.classes=io.opentelemetry.instrumentation.kafkaclients.v2_6.TracingProducerInterceptor
Finally I updated the script used to run the application to add a Java agent and environment variables that configure:
- how the application should identify itself in the traces
- what should be submitted to OpenTelemetry (OTel can be used to collect metrics and logs as well as traces – for this demo, I only want traces)
- where to submit the traces
export OTEL_SERVICE_NAME=demo-processor

export OTEL_TRACES_EXPORTER=otlp
export OTEL_METRICS_EXPORTER=none
export OTEL_LOGS_EXPORTER=none

export OTEL_EXPORTER_OTLP_ENDPOINT=http://$(oc get route -nmonitoring tempo-otel-http -ojsonpath='{.spec.host}')

java \
    -javaagent:$(pwd)/opentelemetry-javaagent.jar \
    -cp ./target/sample-kafka-apps-0.0.5-jar-with-dependencies.jar \
    com.ibm.eventautomation.demos.streamprocessors.JsonProcessor
Instrumenting the consumer
The consumer application uses the Kafka Java client to consume events from the output Kafka topic.
No code changes were needed to get it to submit trace spans to the OpenTelemetry collector, but a few config changes were needed. You can see them in this commit, but I’ll walk through them here.
The simplest way to add the additional Java libraries needed was to get Maven to fetch them for me, by adding this to the dependencies list in my pom.xml
<dependency>
    <groupId>io.opentelemetry.instrumentation</groupId>
    <artifactId>opentelemetry-kafka-clients-2.6</artifactId>
    <version>2.11.0-alpha</version>
</dependency>
I updated the properties file that is used to configure the Kafka Consumer by adding this line:
interceptor.classes=io.opentelemetry.instrumentation.kafkaclients.v2_6.TracingConsumerInterceptor
Finally I updated the script used to run the application to add a Java agent and environment variables that configure:
- how the consumer should identify itself in the traces
- what should be submitted to OpenTelemetry (OTel can be used to collect metrics and logs as well as traces – for this demo, I only want traces)
- where to submit the traces
export OTEL_SERVICE_NAME=demo-consumer

export OTEL_TRACES_EXPORTER=otlp
export OTEL_METRICS_EXPORTER=none
export OTEL_LOGS_EXPORTER=none

export OTEL_EXPORTER_OTLP_ENDPOINT=http://$(oc get route -nmonitoring tempo-otel-http -ojsonpath='{.spec.host}')

java \
    -javaagent:$(pwd)/opentelemetry-javaagent.jar \
    -cp ./target/sample-kafka-apps-0.0.5-jar-with-dependencies.jar \
    com.ibm.eventautomation.demos.consumers.JsonConsumer
Viewing the traces
OpenTelemetry implementations offer different visualisations of the end-to-end traces. In general, they’ll show an end-to-end trace consisting of a series of spans, something like this:
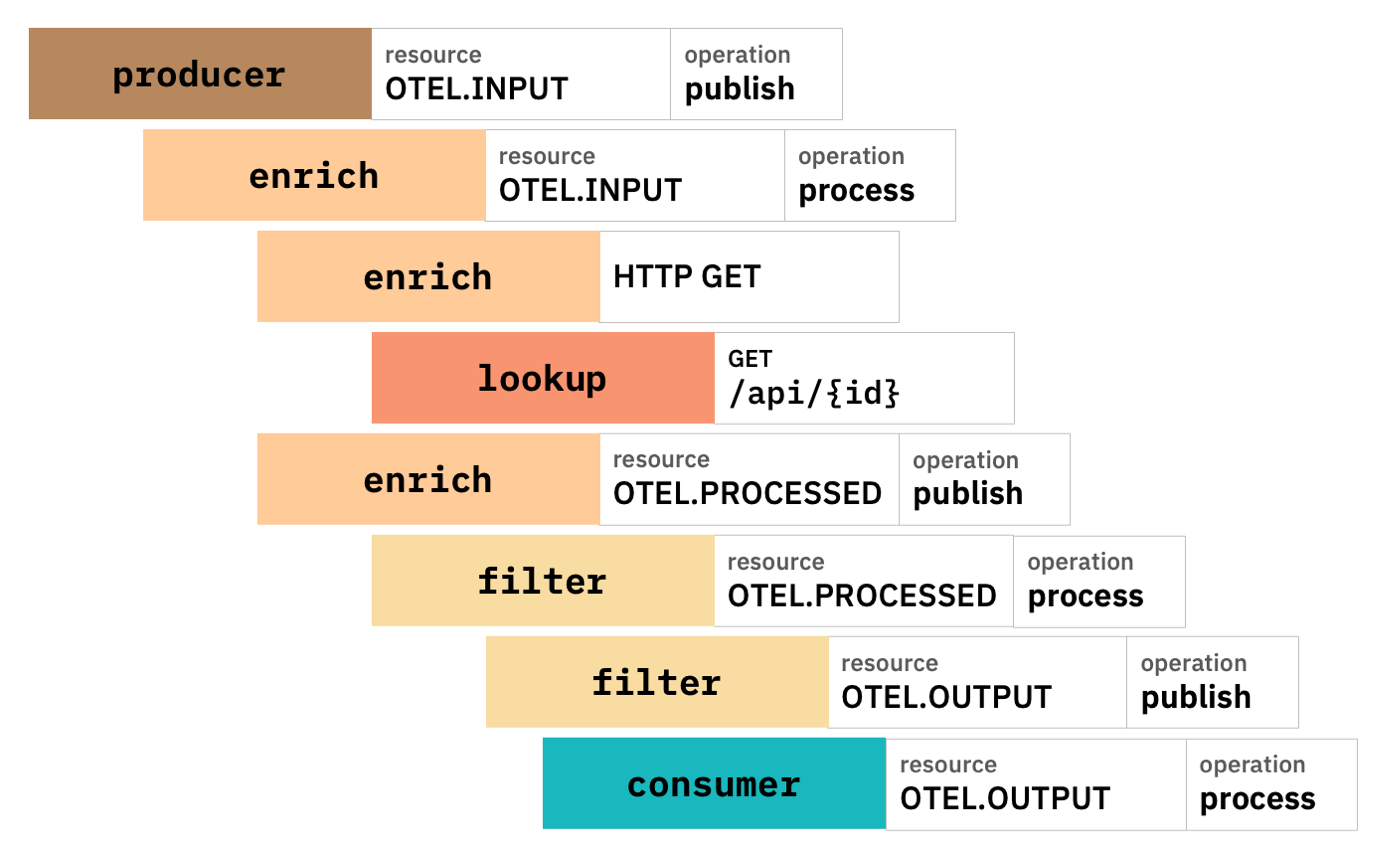
When events are produced to a Kafka topic, this is described as a “publish”. When an event is consumed from a Kafka topic and processed, this is described as a “process”. And the relationship and dependencies between each of these steps can be displayed.
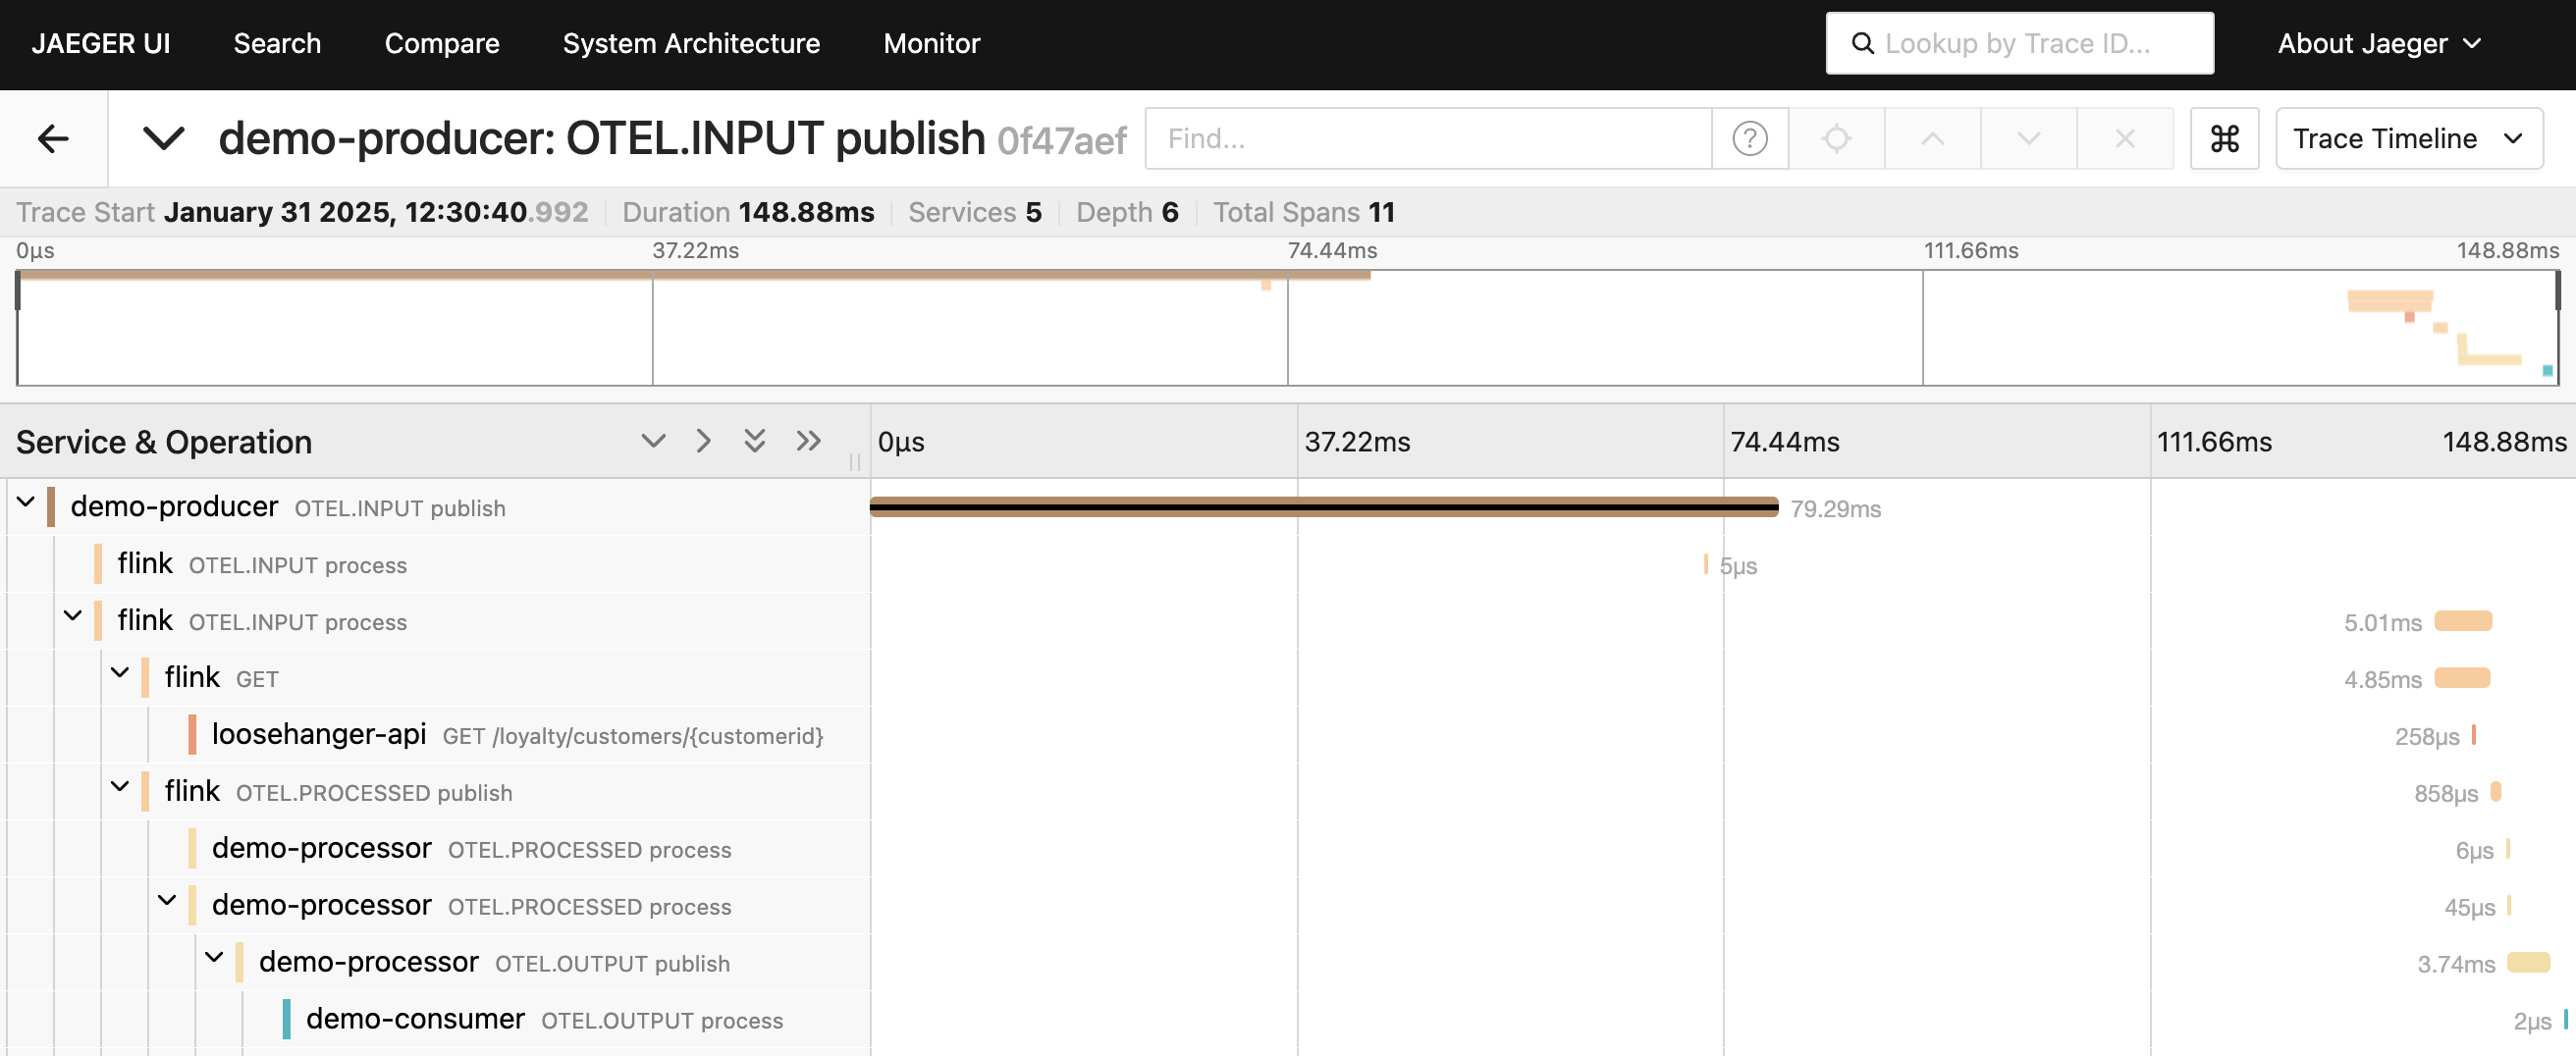
In the Jaeger UI, traces for this demo looked like this:
Using end-to-end traces
The observability offered by the spans collected by OpenTelemetry shows you what is functionally happening in your infrastructure, even if the processing of events is asynchronous and distributed across multiple applications, servers, and systems – which is typical when working with Kafka events.
The timing for the trace shows you what the end-to-end latency is for the overall processing. The timing for each individual span give you an insight into what is contributing to that latency. These timings are an ideal starting point for identifying where to optimize or improve performance.
In this post, I’ve demonstrated how to instrument an existing application. This illustrates that it can be done with only minor configuration updates, however even this does leave the question of when is the best time to do this.
The earlier you can prepare for this the better. But there is a cost to collecting all of these trace spans, and it is unlikely that you will constantly need to review end-to-end traces for all events flowing through your applications.
This still leaves some useful approaches.
One approach is to have the OTel dependencies and Java agent in place, but not activate them – and enable the trace collection when there is a need to investigate what the application is doing. This can be as simple as switching OTEL_TRACES_EXPORTER from “none” to “otlp” or adding the Java agent property. Depending on the way your application is configured this might introduce a need to restart the app.
An alternative approach is to leave the agent collecting trace spans all of the time, configured to collect traces for a sample of Kafka events, rather than every single event. Sampling means that some traces can be available for review whenever needed, and if the sampling rate is low enough this can minimise the overhead of tracing.
Tags: apachekafka, flink, kafka