In this post, I want to share some ideas for how Grafana could be used to create visualisations of the contents of events on Apache Kafka topics.
By using Kafka as a data source in Grafana, we can create dashboards to query, visualise, and explore live streams of Kafka events. I’ve recorded a video where I play around with this idea, creating a variety of different types of visualisation to show the sorts of things that are possible.
To make it easy to skim through the examples I created during this run-through, I’ll also share screenshots of each one below, with a time-stamped link to the part of the video where I created that example.
Finally, at the end of this post, I’ll talk about the mechanics and practicalities of how I did this, and what I think is needed next.
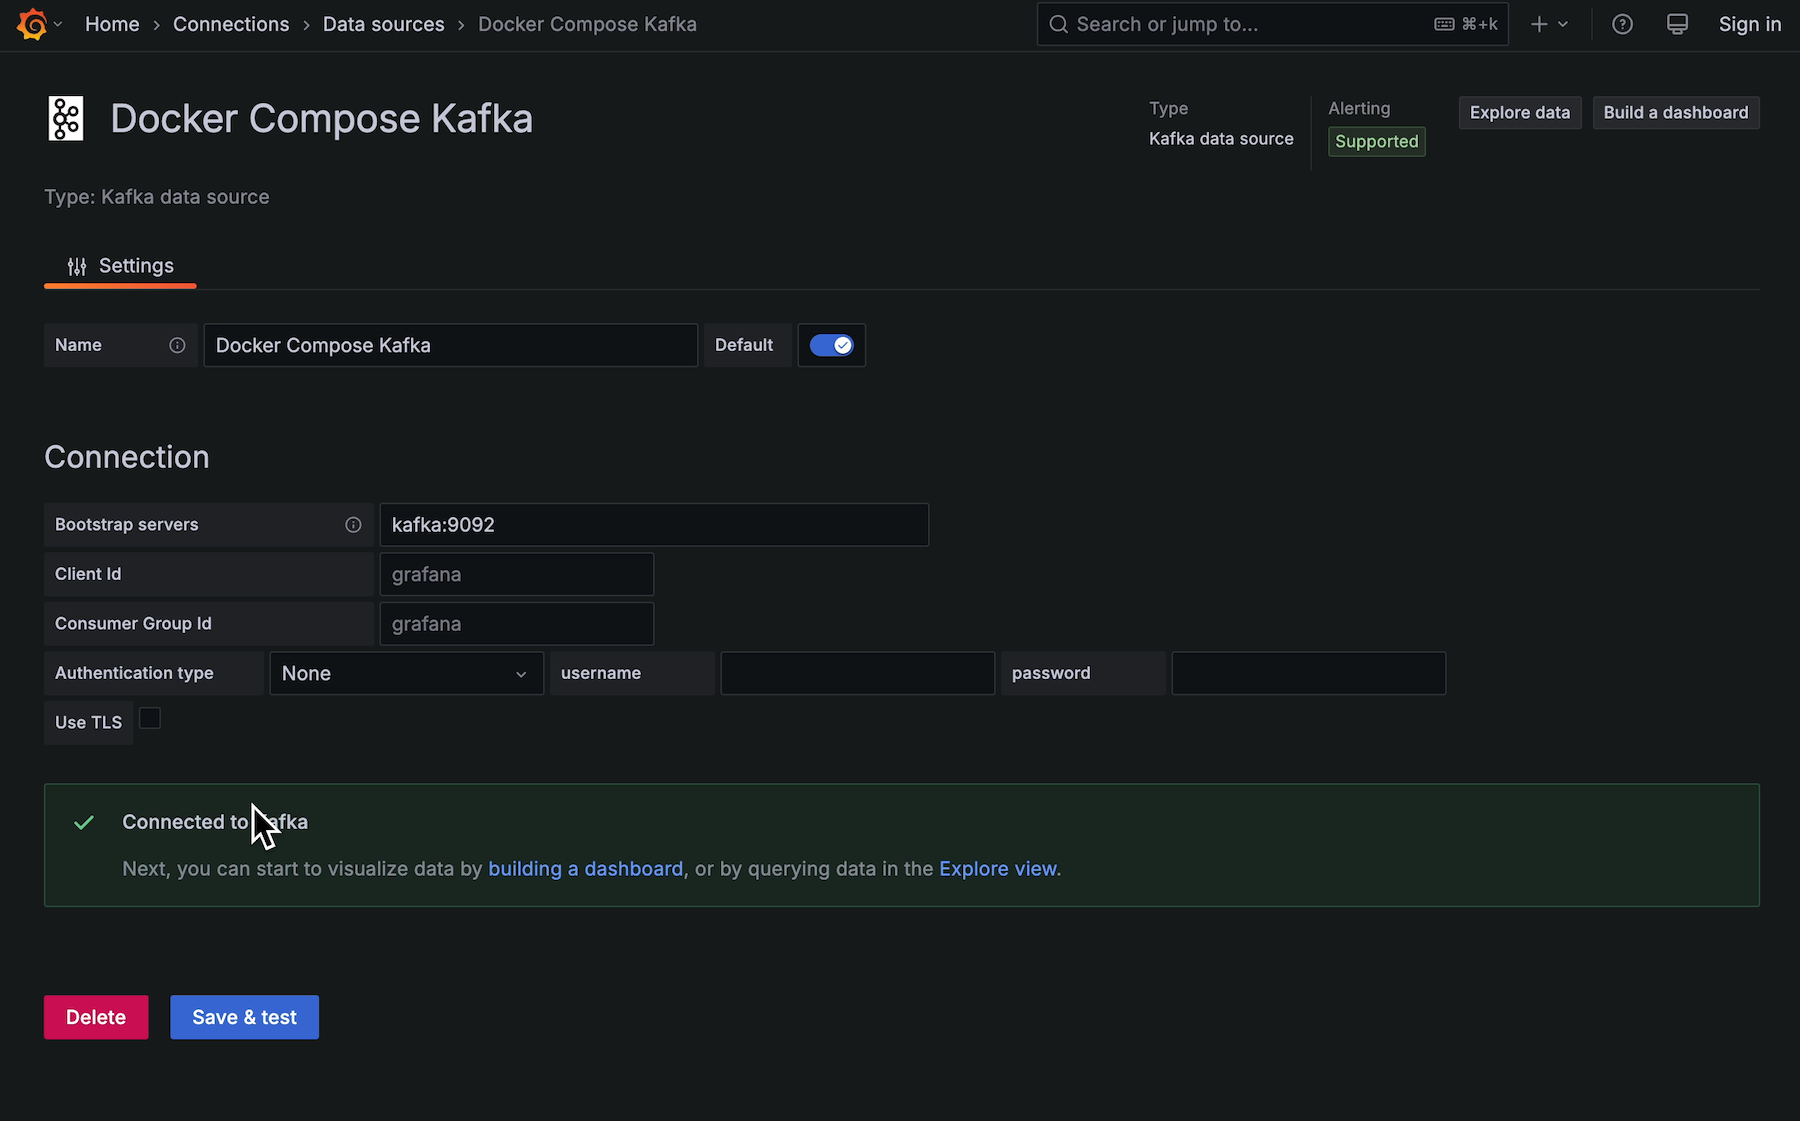
Adding a local, insecure Kafka cluster as a data source
Not a visualisation, but a necessary first step.
Visualising values from sensor readings
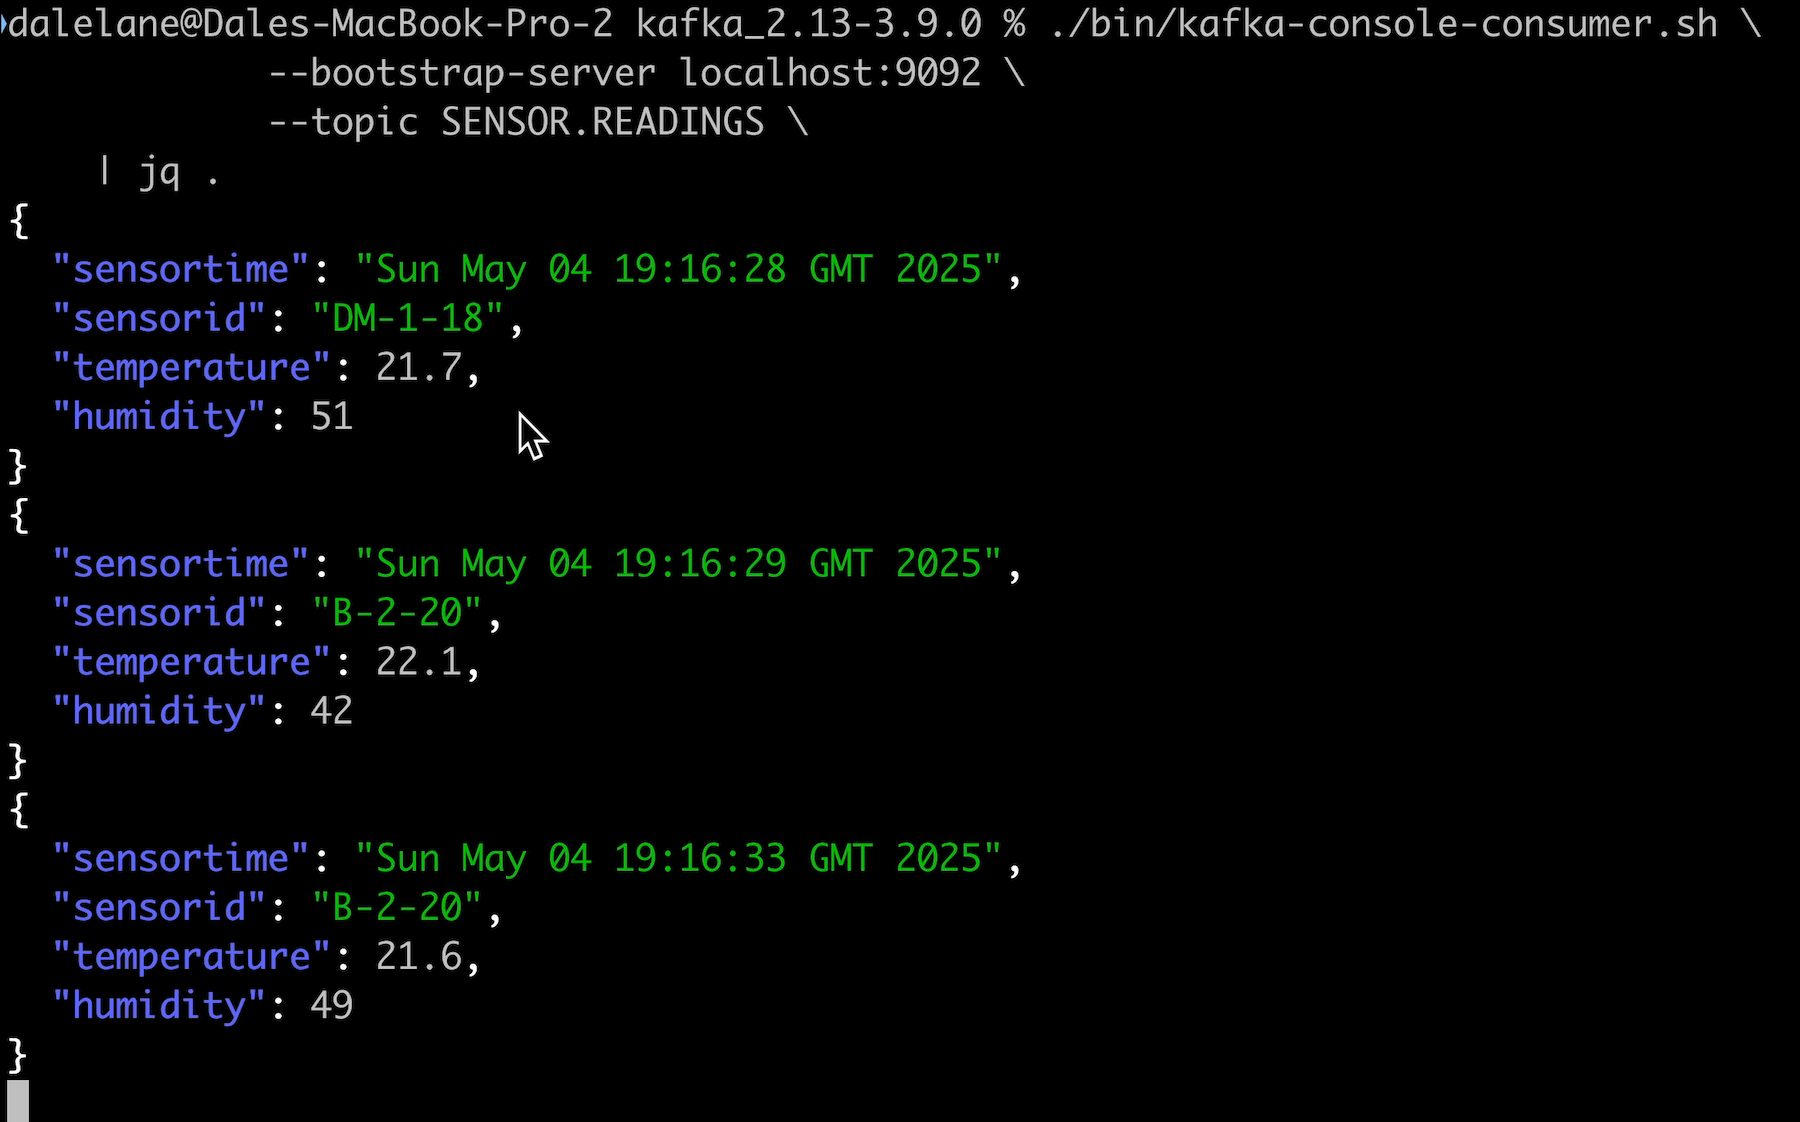
The topic I used for the first few examples was a topic with data from temperature and humidity sensors.
Display a stream of Kafka events in a live, updating table
A useful start before jumping into graphics and visualisations is to just display the JSON events in a tabular form.
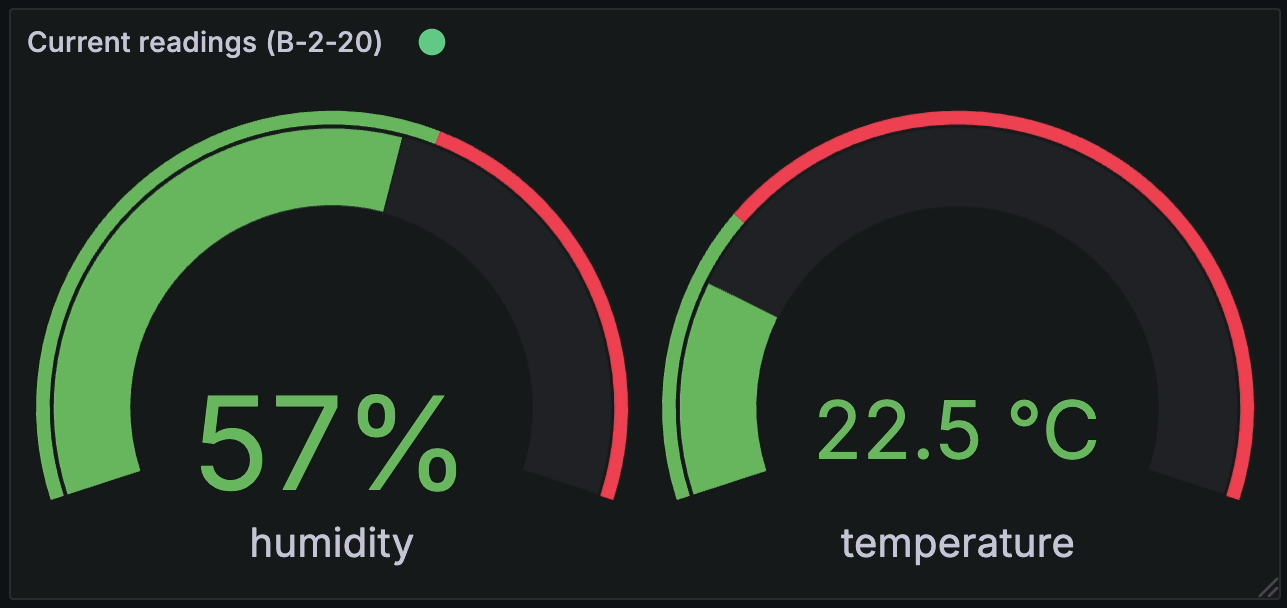
Show values from the most recent event in a gauge
A live, dynamic display of the values from the most recent event on the topic, using a curved bar and dynamic colours to indicate what the values mean.
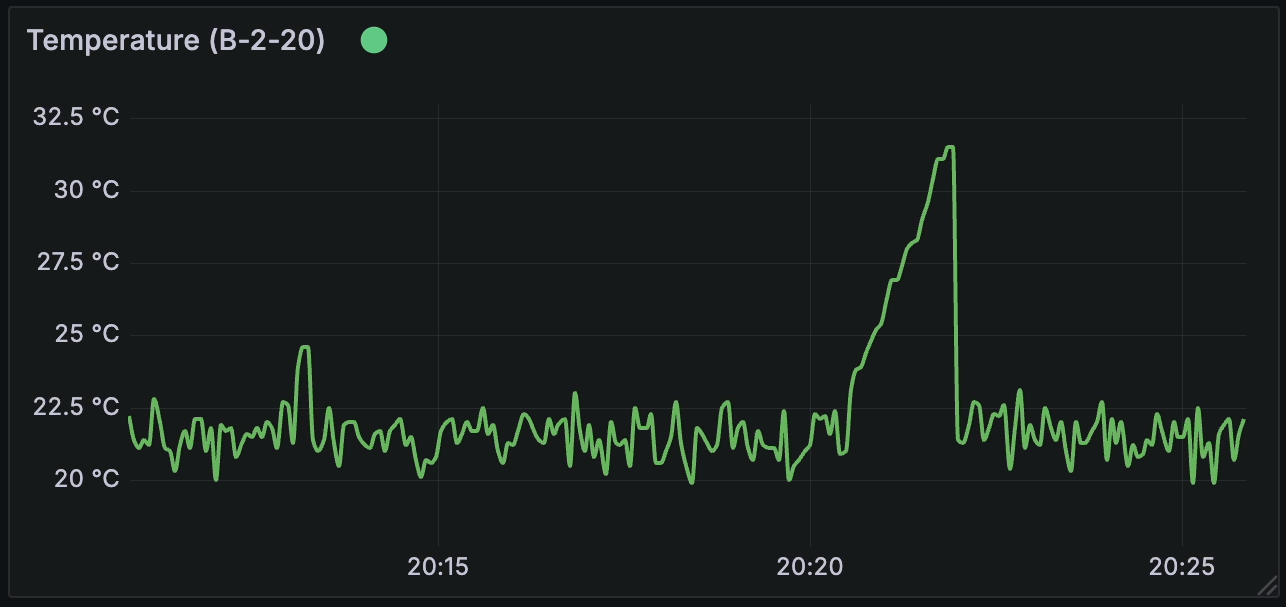
Generate a time series line for recent numerical data in events
A live, updating line graph can show how the values in the events change over time.
Visualising values from order events
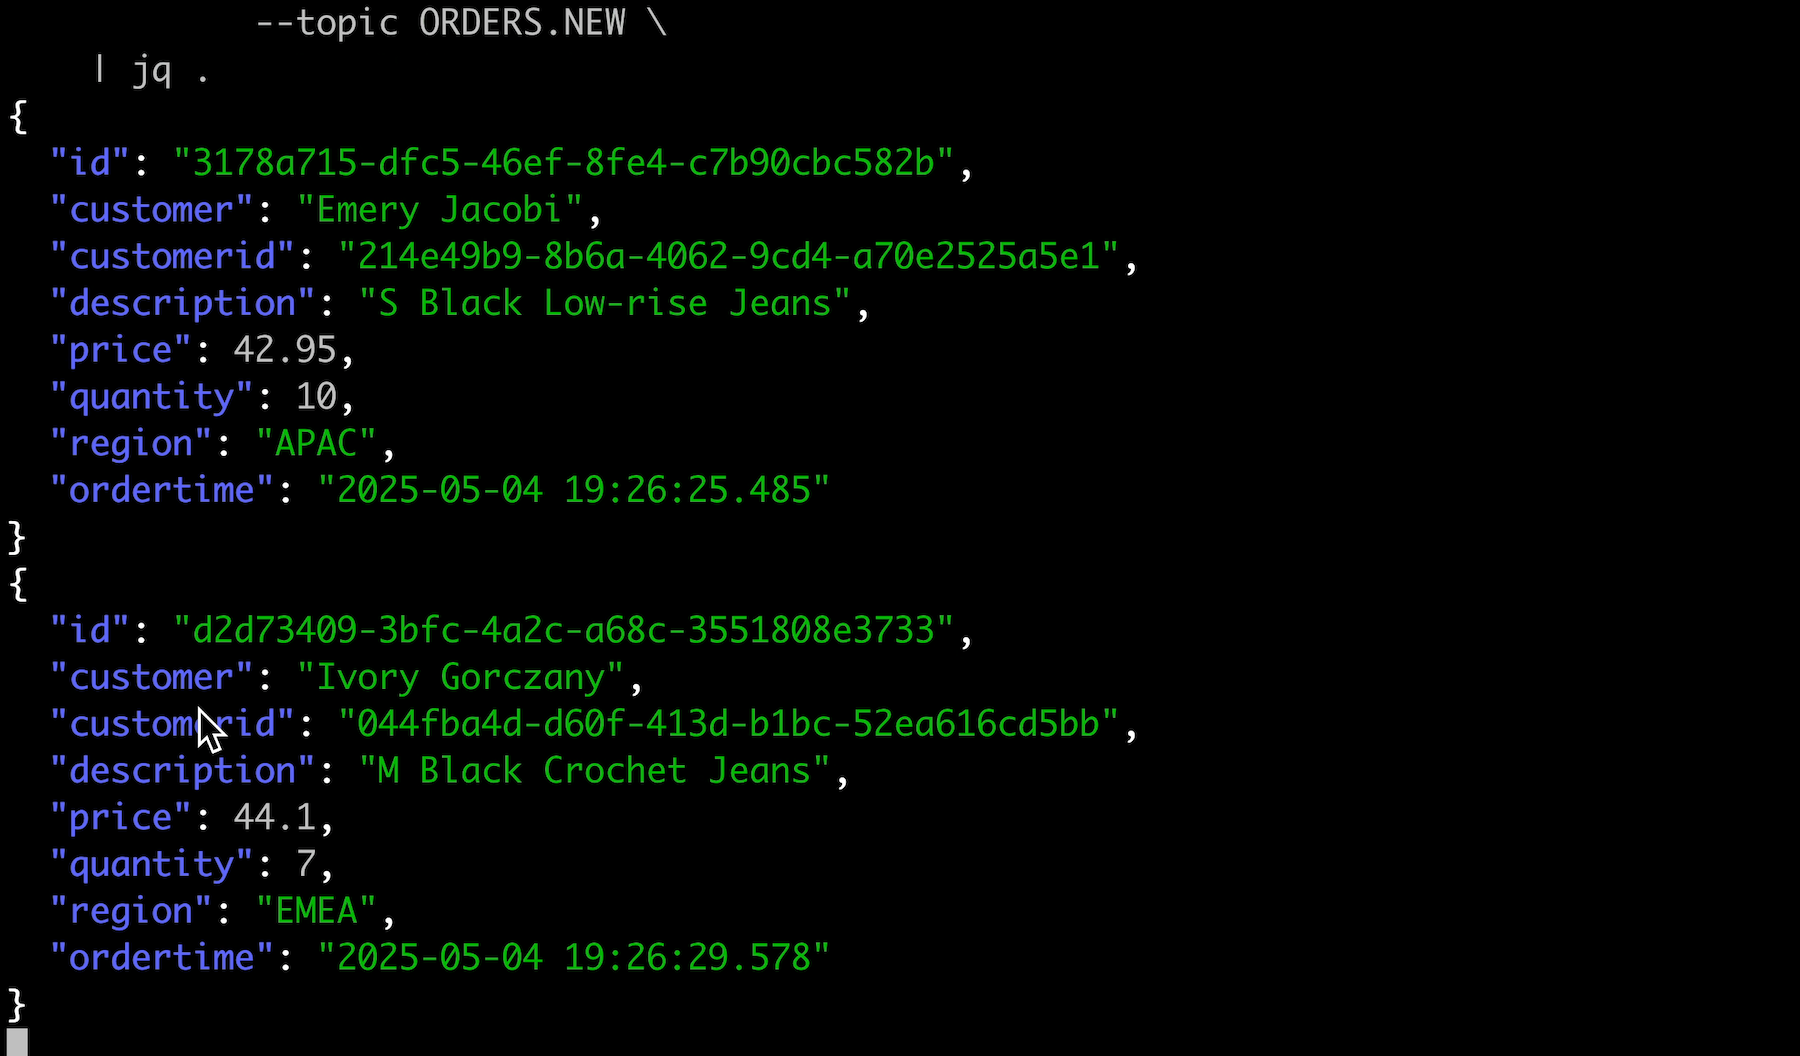
The topic I used for the next examples was an orders topic with events containing a mixture of numeric, string, and categorical values.
Display a stream of Kafka events in a live, updating table
As before, I started with a scrollable, paginated view of the JSON events in a table.
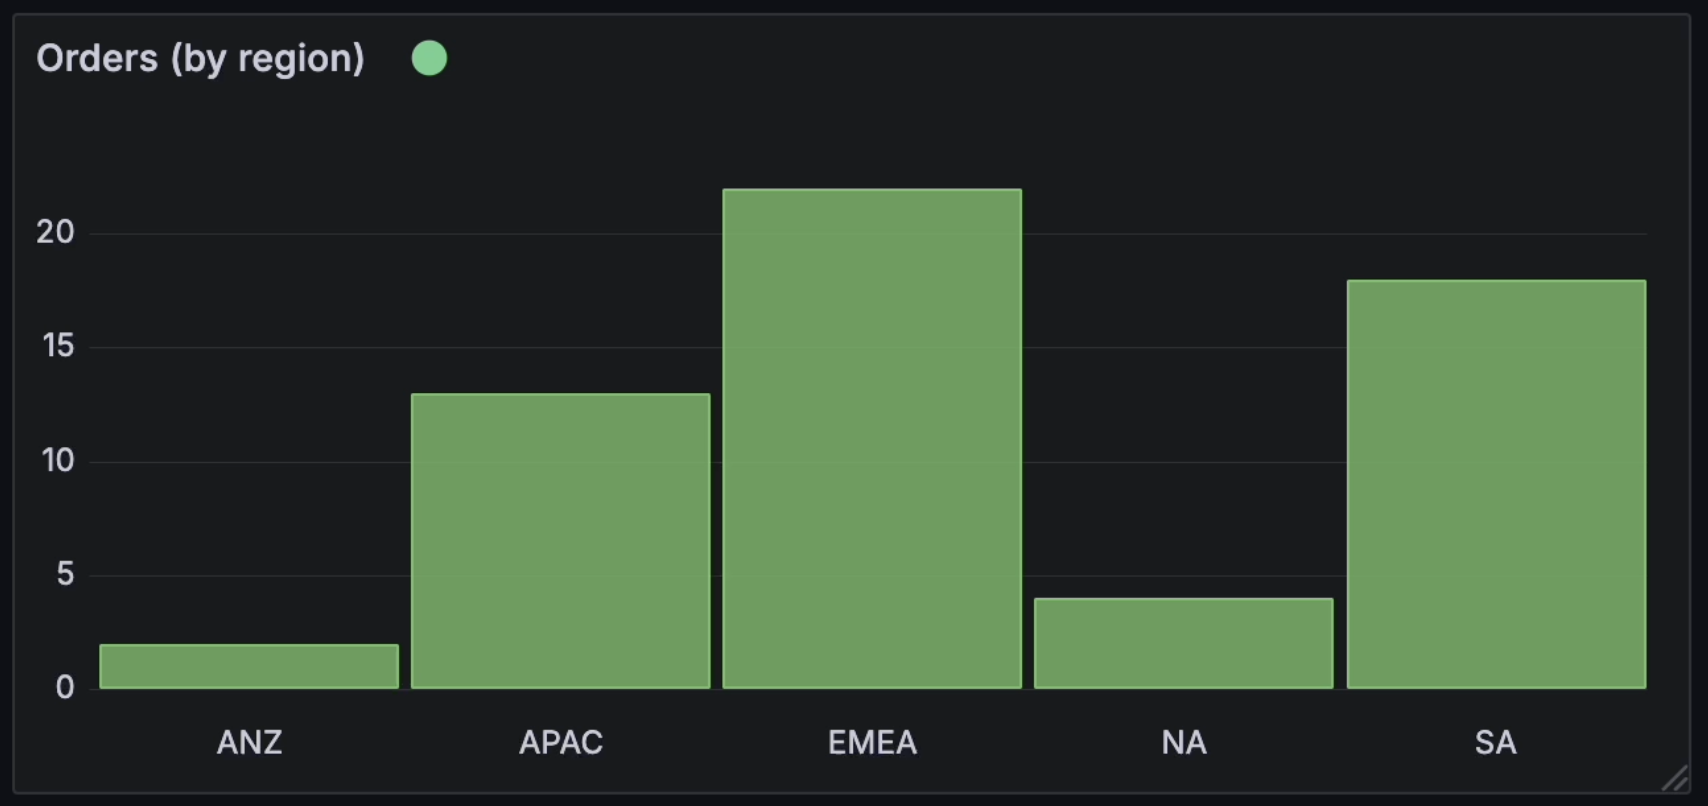
Using a bar chart to understand the distribution of categorical data
A dynamic bar chart that shows the number of events that included different values for one of the enums / categorical properties in the data.
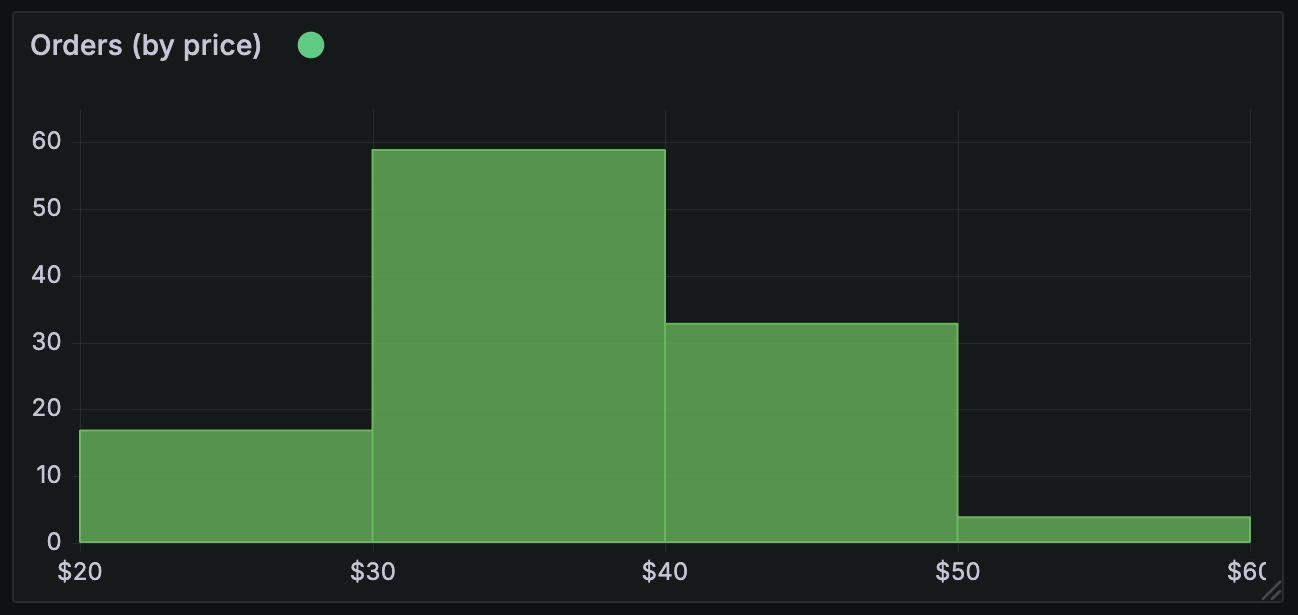
Using a histogram to understand the distribution of numerical data
A dynamic histogram that shows the number of events with numerical values within certain ranges.
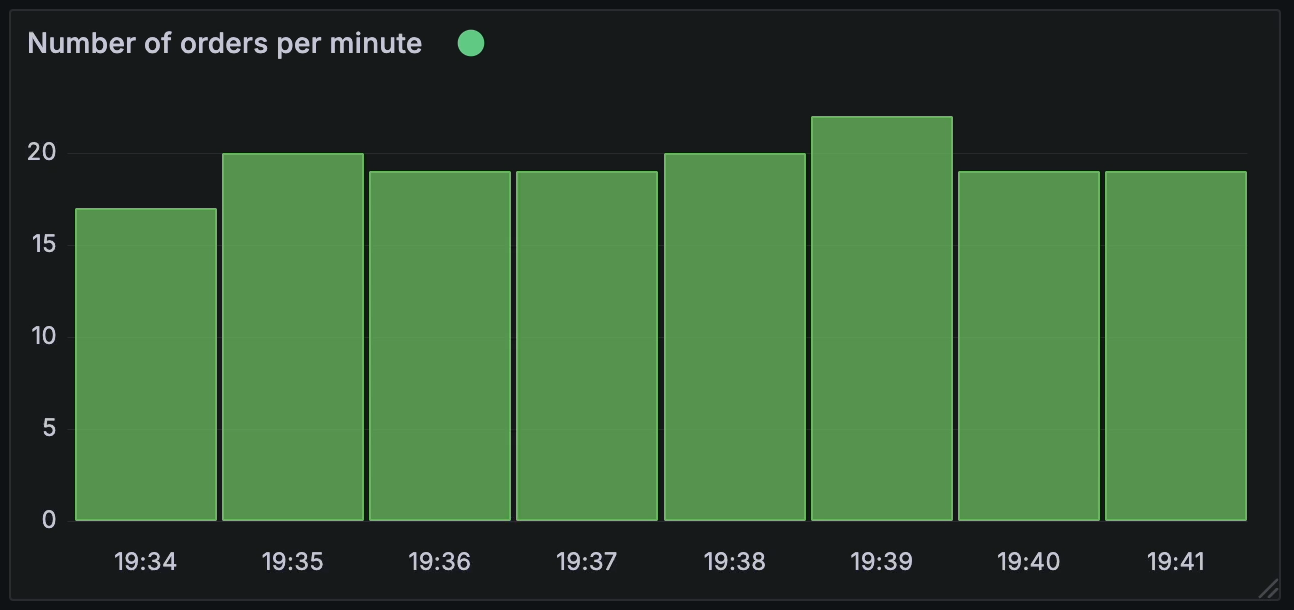
Using a bar chart to display the frequency of events
It isn’t just the contents of the events that we can visualise, but also metadata such as how frequently events are being produced. I used a bar chart to show the number of order events per minute.
Displaying statistical summaries of numerical data
A dynamic table showing simple statistical summaries of numerical values in the events.
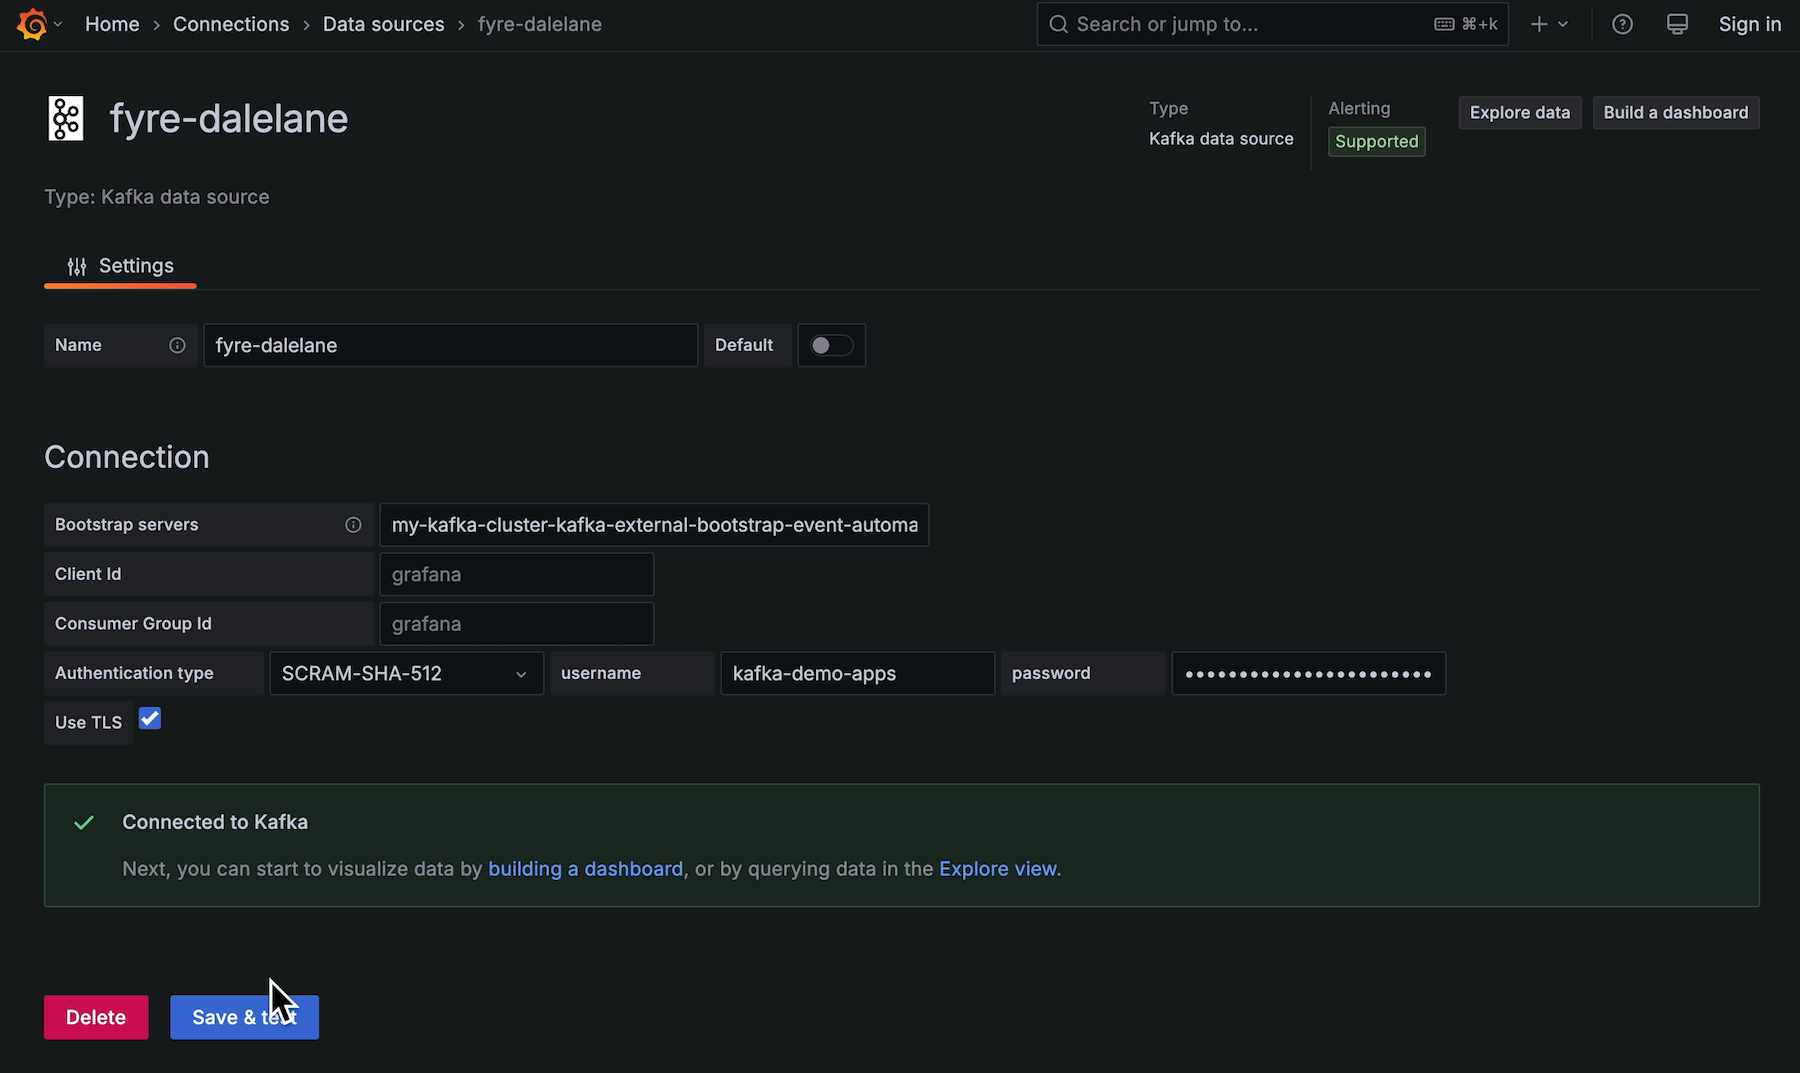
Adding a remote, authenticated Kafka cluster as a data source
Not a visualisation, but a necessary first step.
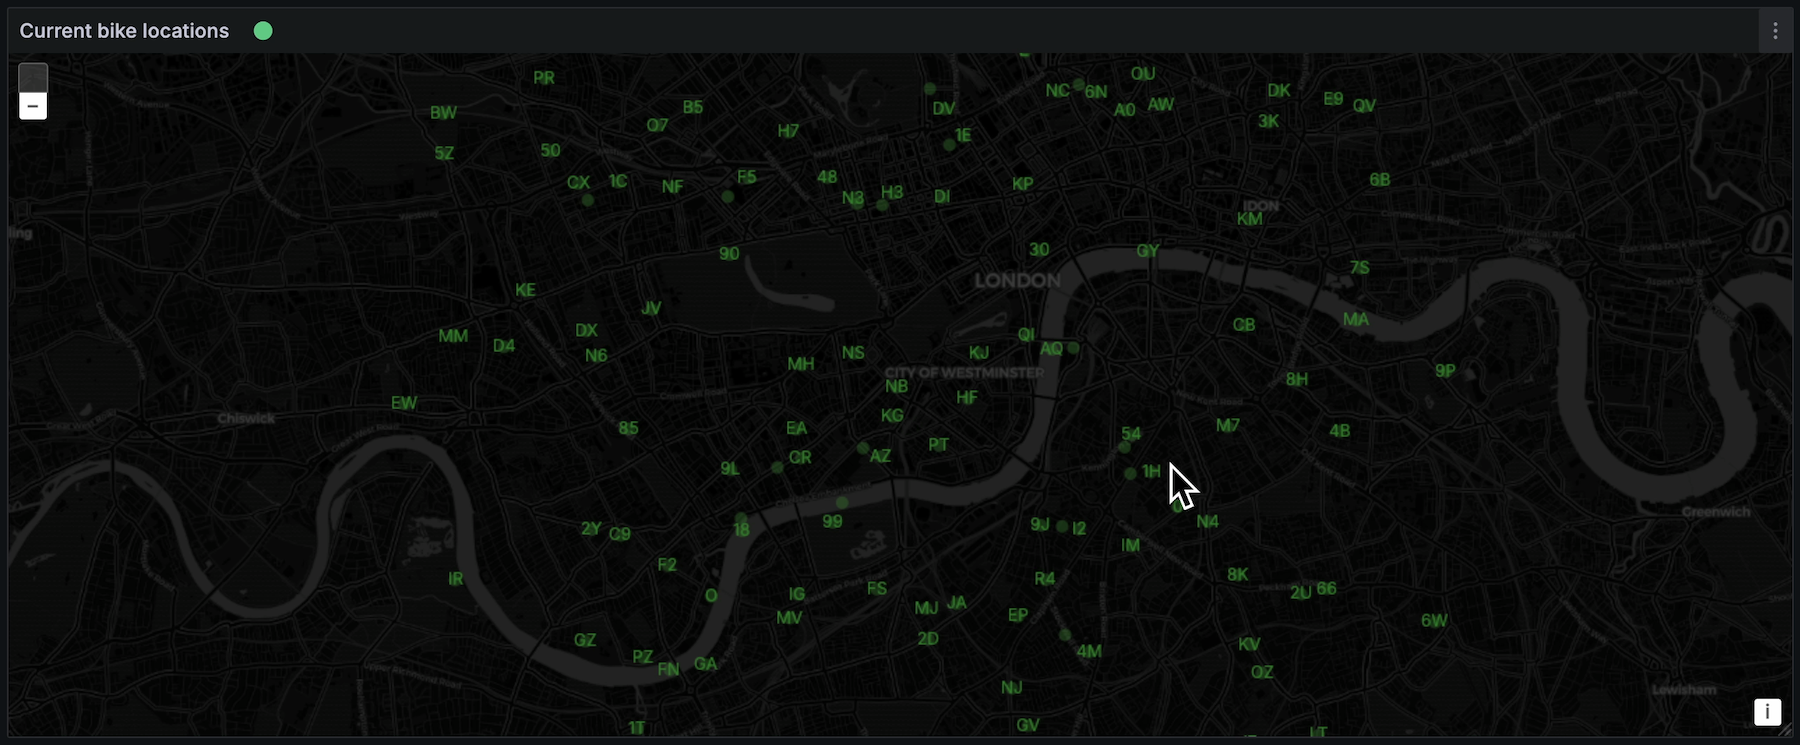
Plotting geo-spatial events on a map
A stream of events that contain location data can be visualised as live, moving labelled events on a dynamic map – displaying additional data about map points when you hover over them.
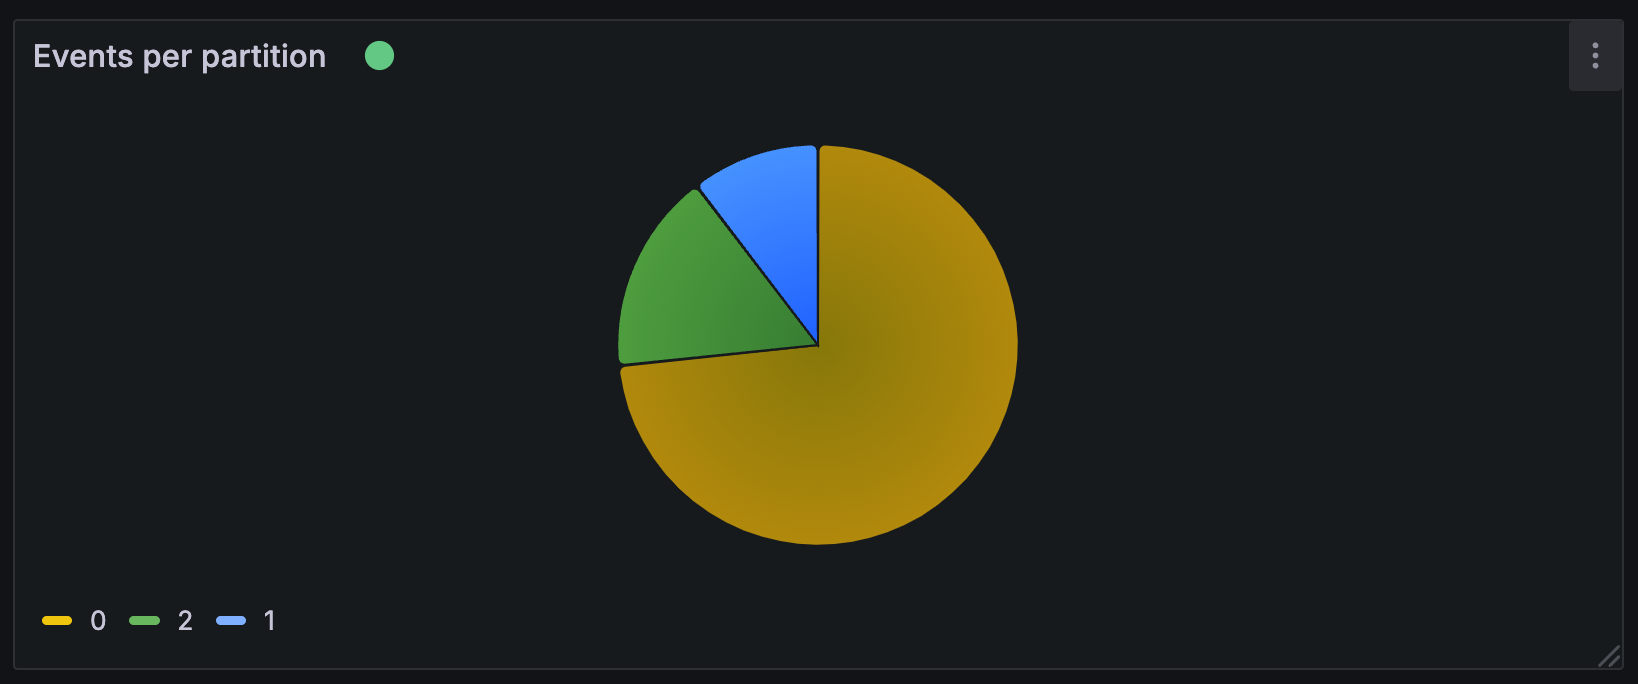
Displaying distribution of events across topic partitions in a pie chart
It isn’t just the contents of the events that we can visualise, but also metadata such as the distribution of events on a multi-partition topic. This could help show the effectiveness of the key strategy in the data.
Other visualisations
Those were just what I managed to come up with during half-an-hour of experimentation and playing. I’m sure that someone with more imagination and Grafana skills could do more!
Mechanics and practicalities
Finally, I’ll finish by talking about what we need to be able to do this sort of thing. Grafana’s support for different data sources comes from data source plugins – so we need a Grafana data source plugin that can run Kafka consumers.
I couldn’t find one, so I had a go at creating it – you can find it at github.com/dalelane/grafana-kafka-datasource.
This is not only my first exploration of working with the Grafana API, it’s also my first attempt to write anything using the Go programming language (part of the motivation for this project was giving me an excuse to give Golang a try, which I’ve meaning to do for years!).
All of this is a long-winded excuse to say that my plugin is still a little rough around the edges but it’s a start. (I would welcome input from people who actually know what they’re doing in Go to point out the more ignorant and naive aspects of what I’ve done!)
I’ve submitted it to Grafana so I can get it signed. That will make it easier for you to install it in your Grafana instance and try it out for yourself. (I’ve not done this before, so I have no idea how long this process takes.)
In the meantime, you can still install the unsigned plugin from my Github repo, but you’ll need to allow unsigned plugins for this to work.
What now?
In summary, I’ve got a plugin that mostly works, and (at time of writing in early May 2025) is perhaps best thought of as a pre-release beta. I thought it was worth sharing even in this early phase to see what interest there is.
Please get in touch if:
- you think you’d find this useful
- you know Go and can see what I’ve done wrong
- you know Go and would like to contribute to the plugin
- you have ideas for what else could be done using Kafka as a Grafana data source
Tags: apachekafka, kafka
