Overview
A quick howto for if you’re running UIMA in a servlet, and want to be able to monitor your AE performance using JMX
Background
I’ve mentioned JMX before. Basically, a Java app can expose information and methods through a standard interface. Tools like jconsole, which come with Java, can then be used to monitor and administer the Java app.
UIMA (Unstructured Information Management Architecture) is an Apache project, providing a standards-based way to perform analytics on unstructured text. It hosts a pipeline of annotators: individual components each performing a specific text analytics task. As a document moves down the pipeline UIMA runs each of the annotators on the document. Each annotator adds it’s own annotations for the things it looks for in the text.
UIMA and JMX
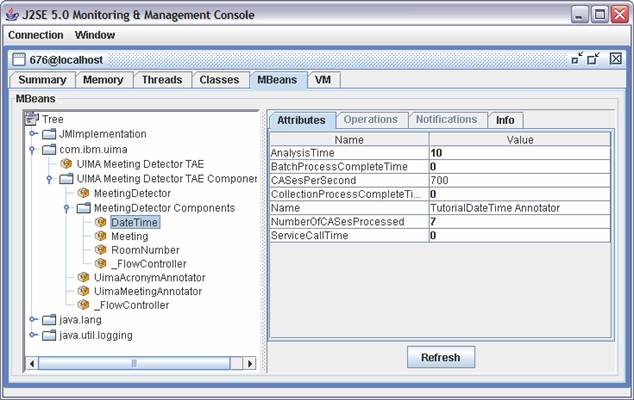
UIMA supports JMX. UIMA registers an MBean for each annotator, letting you see the performance info for each annotator. In a pipeline of several annotators, it lets you see (amongst other things) how much time your document is spending in each annotator.

In a stand-alone UIMA application, you basically get this for free. Start the application with the standard Java -D property for enabling JMX:
-Dcom.sun.management.jmxremote
It is ready to let jconsole connect to it.
UIMA in a servlet
For a current project, I’m running a UIMA pipeline in a Java servlet on Tomcat. I need to run the server with the JMX property, but there is slightly more to it than that.
Basically, you need to manually register the analysis engine pipeline with JMX. From there, UIMA will handle registering all of the annotators and other components in the pipeline.
Because the servlet can be started and stopped separate from the server as a whole, the easiest way to do this is from a ServletContextListener.
Step 1: Register the context listener
Add something like this to your web.xml
<listener>
    <listener-class>com.dalelane.uima.myapp.PipelineJMXMonitor</listener-class>
</listener>
Step 2: Create the context listener
If you get a handle to your UIMA AnalysisEngine, it has a method getManagementInterface() for getting the JMX management interface.
In your context listener’s contextInitialised method, you can register this interface with the MBean server. In the context listener’s contextDestroyed method, you need to unregister it.
package com.dalelane.uima.myapp;

import java.util.List;

import javax.management.MBeanServer;
import javax.management.MBeanServerFactory;
import javax.management.ObjectName;
import javax.servlet.ServletContextEvent;
import javax.servlet.ServletContextListener;

import com.dalelane.uima.MyPipelineService;

public class PipelineJMXMonitor implements ServletContextListener {

  @Override
  public void contextInitialized(ServletContextEvent sce) {
    try {
      getMBeanServer().registerMBean(
          MyPipelineService.getInstance().analysisEngine.getManagementInterface(),
          new ObjectName("Application:Name=MyUIMAApp,Type=Server"));
    }
    catch (Exception e){
      e.printStackTrace();
    }
  }

  @Override
  public void contextDestroyed(ServletContextEvent sce) {
    try {
      getMBeanServer().unregisterMBean(
          new ObjectName("Application:Name=MyUIMAApp,Type=Server"));
    }
    catch (Exception e) {
      e.printStackTrace();
    }
  }

  private MBeanServer getMBeanServer(){
    List<MBeanServer> servers = MBeanServerFactory.findMBeanServer(null);
    return servers.get(0);
  }
}
Step 3: Start the server
Start the server with the -Dcom.sun.management.jmxremote option, and it’ll be ready for using jconsole to monitor it.