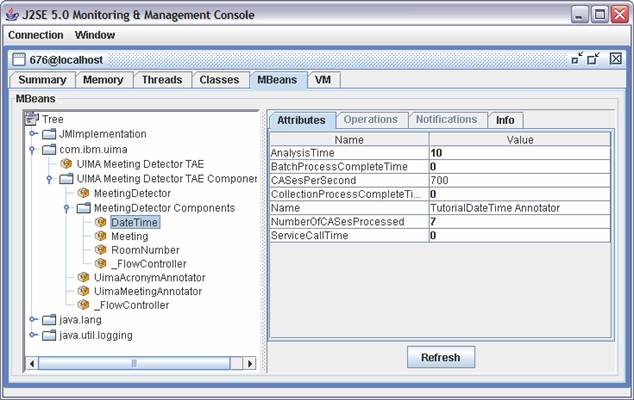
Overview
A quick howto for if you’re running UIMA in a servlet, and want to be able to monitor your AE performance using JMX
Background
I’ve mentioned JMX before. Basically, a Java app can expose information and methods through a standard interface. Tools like jconsole, which come with Java, can then be used to monitor and administer the Java app.
UIMA (Unstructured Information Management Architecture) is an Apache project, providing a standards-based way to perform analytics on unstructured text. It hosts a pipeline of annotators: individual components each performing a specific text analytics task. As a document moves down the pipeline UIMA runs each of the annotators on the document. Each annotator adds it’s own annotations for the things it looks for in the text.
UIMA and JMX
UIMA supports JMX. UIMA registers an MBean for each annotator, letting you see the performance info for each annotator. In a pipeline of several annotators, it lets you see (amongst other things) how much time your document is spending in each annotator.

In a stand-alone UIMA application, you basically get this for free. Start the application with the standard Java -D property for enabling JMX:
-Dcom.sun.management.jmxremote
It is ready to let jconsole connect to it.