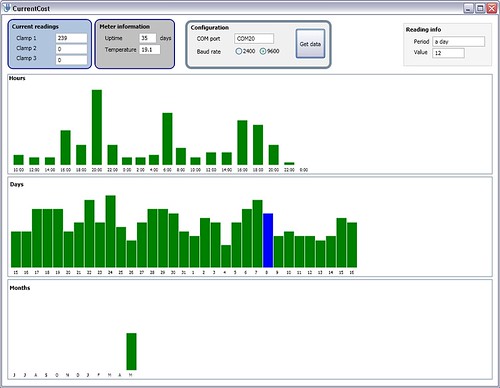
I spent a bit of tonight tweaking last night’s CurrentCost app.
Not a lot to say about it, as it’s more or less the same as it was last night…
Adding axes to the bar graph
The most noticeable difference is that I worked out a way to add labels to the graphs. As I said last night, I’ve been learning to use WPF to draw the GUI, and starting to get my head around the approach to data binding – separate the data (in your C# objects) from the interface (specified in XAML).
Last night, I started by creating a bar graph as a series of programmatically-generated Rectangles. I’ve now replaced this by specifying a DataTemplate for the bar graph control:
<DataTemplate x:Key="template">
    <StackPanel Orientation="Horizontal" VerticalAlignment="Bottom">
        <StackPanel Orientation="Vertical" VerticalAlignment="Bottom">
            <Rectangle
                Height="{Binding Path=Value}"
                Width="20"
                Fill="Green"
                MouseEnter="Rectangle_MouseEnter"
                MouseLeave="Rectangle_MouseLeave" />
            <Label Content="{Binding Path=Key}" FontSize="8" />
        </StackPanel>
        <Rectangle Width="1" /> <!-- spacing -->
    </StackPanel>
</DataTemplate>
Instead of being a stand-alone Rectangle, each item in the data collection where I store CurrentCost data is represented by a Rectangle (with the height specified by the value from the CurrentCost reading), and a Label (with the text specified by the label from the CurrentCost reading).
Then I use MouseEnter and MouseLeave events to change the colour and populate the text boxes at the top – rather than try to add vertical axes, if you hover over a bar on the graph, you can see the reading for that bar.
The more I play with WPF, the more I’m starting to like it…
CurrentCost history data
Adding the labels to the graph had the unexpected bonus of highlighting that I’d misunderstood the history data a bit. I’ve since gone back and fixed my code from last night, and added a comment to explain how I think the hourly history works.
Time
I’ve got rid of the option to choose between the computer or CurrentCost meter as a time source, as it was fairly pointless. It’s the CurrentCost meter that’s collecting this data, so you kind of need it’s time to be accurate.
I replaced it with a line of code that checks the timestamp from a reading when you get it – if it’s significantly different to the current time on your computer, you will get a prompt warning you and advising you to correct the clock on your CurrentCost meter.
Surprisingly, mine was running 56 minutes slow. These things really lose time fast! 🙁
The updated version is available for download if anyone wants to give it a try.
Tags: currentcost, wpf

My CurrentCost meter also loses a lot of time – roughly an hour every three weeks.
Maybe an alternative way to reminding the user to reset the clock would be to store the computer time and currentcost time at the point of last correction. Then next time the device is connected, the application can determine the time that has elapsed since the device was last seen, and the amount of ‘slip’ that has occured during that time, and shift everything accordingly.
(For example, if you haven’t connected the device for a week, and when you do connect it the app sees that the CC time vs. the computer time has slipped by 70 minutes since the last connection, it can adjust day 1’s readings by 10 minutes, day 2’s by 20 minutes, and so on).
I would imagine the slip factor would be steady enough that you could get sufficiently accurate data using this method. The disadvantage of this is that if you did reset the CurrentCost clock, it would then be shifting the times incorrectly…
[…] With friends and colleagues at work, we’ve been playing with different things that we can do with this data. For example, last week I made a start on a Windows GUI for the CurrentCost data. […]
Alexis: I understand that the crystal used to run the clock in the display is very cheap. Although it slips a lot when it’s new it supposedly gets better as it gets older. I’d never heard this before, but cheap crystals improve as they are ‘run in’. It initially sounded like nonsense to me but the guys at CurrentCost say it’s true.
Hello Dale,
I run an annual event called Energy Saving Day (E-Day) and am writing to ask if you would be interested in exploring the scope for a collaboration?
I’m very impressed by what you and your friends achieved at Mashed, primarily because I have been looking for a streamlined way of achieving something similar ever since I created a national electricity meter for this year’s E-Day in February.
I am especially keen to find a way of helping potential energy savers to cut out the cost of a buying special metering display and/or patented induction loop and have a few ideas which it might be good to knock around with you if you were interested…
The links below will tell you a little about what I have done up until now and I would be happy to tell you more about my plans for next year’s E-day if my suggestion of a collaboration appeals you.
Warmest regards and thanks
Matt
E-Day homepage http://www.e-day.org.uk
Facebook Group http://oxford.facebook.com/group.php?gid=9526180142
You Tube channel http://youtube.com/energysavingday
http://news.bbc.co.uk/1/hi/sci/tech/7209817.stm
http://news.bbc.co.uk/1/hi/sci/tech/7334774.stm
Ban The Bulb : http://www.banthebulb.org
http://news.bbc.co.uk/1/hi/sci/tech/4667354.stm
http://news.bbc.co.uk/1/hi/sci/tech/4922496.stm
Global Carbon Tax : http://www.carbontax.org.uk
http://news.bbc.co.uk/1/hi/sci/tech/7471197.stm
[…] spent a couple of evenings last month knocking together a quick example of a Windows GUI for the data you get from CurrentCost home electricity use monitors. And then promptly put it to one side and kinda forgot about […]
[…] original code was written in C# using .NET 3.5, and I used WPF (Windows Presentation Foundation) to draw the […]
[…] web site, as I was testing with X30 Laptop running XP.? Also updating to .Net framework 3.5 to get Dales’ Windows GUI application to run.? ? This ran just fine, and the ease with which I had everything up and running was a little […]