Machine Learning for Kids now includes interactive visualisations that explain how some of the machine learning models that children create work.
The tool lets children learn about artificial intelligence by training machine learning models, and using that to make projects using tools like Scratch. I’ve described how I’ve seen children learn a lot about machine learning principles by being able to play and experiment with it. But I still want the site to do more to explain how the tech actually works, and this new feature is an attempt to do that.
Let’s start with a trivial example.
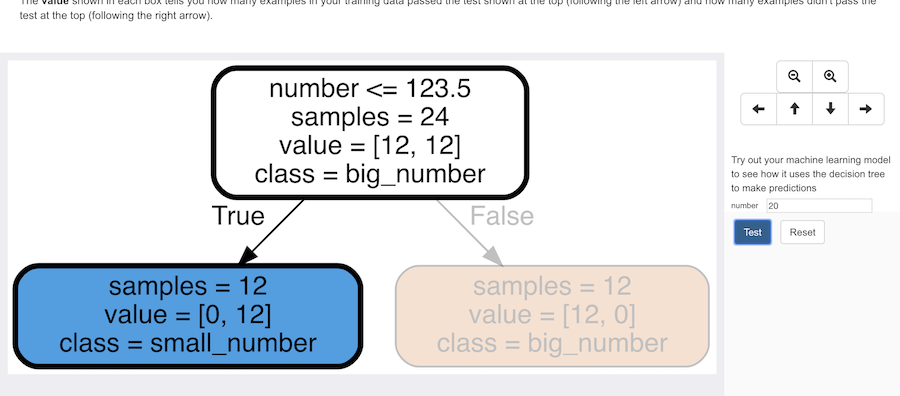
Imagine you want to train a machine learning model to recognize if a number is a big number or a small number. (Not a great use of machine learning, I admit…)
You start by collecting examples of big numbers, and examples of small numbers.
You use this to train a machine learning model. And as well as letting you use it from Scratch, App Inventor, or Python, the website lets you experiment with the model – trying out values with it to see what it would predict.
If you give it a small number, it displays the prediction and the confidence score for that prediction.
What I’ve now added to the site is a visualisation of how that prediction was made.
The site generates a visualisation of the decision tree classifier that you’ve created.
To try and make it clearer how it works, I’ve made it interactive.
If you enter some test values, it highlights the nodes of the tree that were used to make a prediction.
You start at the top of the tree, and follow it until you reach a leaf node at the bottom of the tree.
Each node describes the test that is applied – if your test values pass the test, it follows the left node, otherwise it follows the right node.
That’s the basic idea, but no-one is using machine learning to recognize if numbers are big or small, so let’s see what a real visualisation looks like.
Explaining Pac-Man
Pac-Man is a popular project. Students create a simple version of Pac-Man in Scratch, using the arrow keys to control Pac-Man and avoid the ghost.
By playing the game, they collect training examples for their machine learning model.
They can see that in their training page. Each training example has four numbers: the x,y coordinates for Pac-Man, and the x,y coordinates for the ghost – each example records the location of the Pac-Man and the ghost when they made a move.
Each training bucket represents the four moves that Pac-Man can make (go up, down, left or right).
If Pac-Man was at x=3,y=4 and the ghost was at x=6,y=5, and they pressed the down arrow, then the training example (3,4,6,5) will be added to the “down” bucket.
They use that to create a machine learning model that can predict the best direction for Pac-Man to go, based on the current character locations.
If they enter locations for Pac-Man and the ghost, they can test what their machine learning model predicts Pac-Man should do.
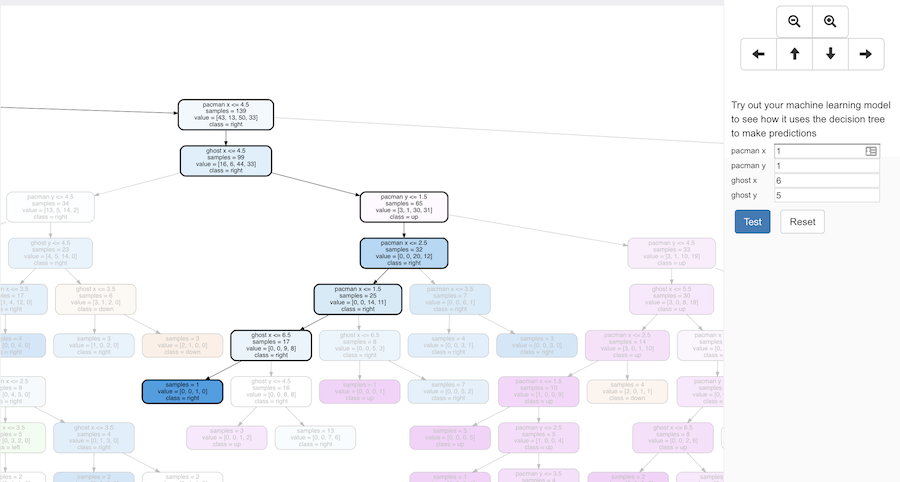
They can experiment to see if it makes predictions they would agree with. For example, if Pac-Man is at x=1,y=1, and the ghost is at x=6,y=5, my machine learning model predicted that Pac-Man should go right.
And they use this in Scratch to put the machine learning model in charge of the character, using the predictions from the machine learning model to control Pac-Man.
With the new visualisation feature, now they can see how that works!
The decision tree created for a project like this quickly gets quite large.
The decision tree graphic is a vector, so students can zoom right in.
I’ve added controls so they can easily pan around to focus on different sections of the tree.
And the interactivity means they can enter in test coordinates, and see how the tree is used to make a prediction.
Using the same coordinates as before (Pac-Man at x=1,y=1 and the ghost at x=6,y=5) it looks like this:
Explaining Noughts and Crosses
Noughts and Crosses is a more complicated version of the same idea.
There are nine training buckets this time, representing the nine possible moves that the machine learning model needs to be able to predict.

The project works in the same way, with students collecting their training examples by playing games of Noughts and Crosses in Scratch.
And they train a machine learning model that predicts the best place to make the next move, so they train a Scratch game to play against them.
The training examples they collect are a description of the contents of each space on the noughts and crosses board, and go into the training bucket for the move that they made at that time.

The decision tree for this can get very big.
But it gets very good at making decisions for playing the game.
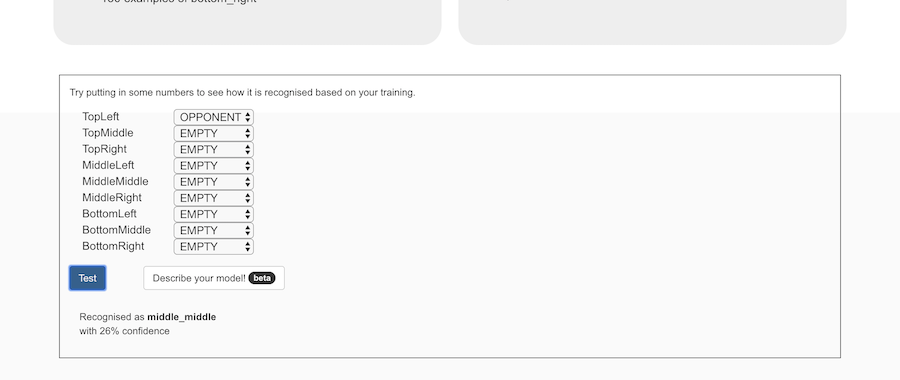
For example, if cross makes it’s first move in the top left corner…
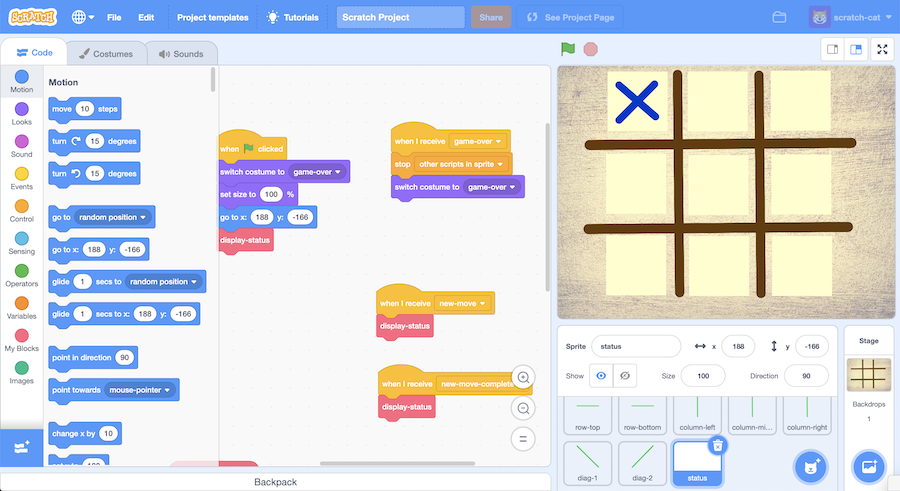
…my machine learning model predicts that noughts should go in the centre space.
Now students can see for themselves why it makes that prediction.
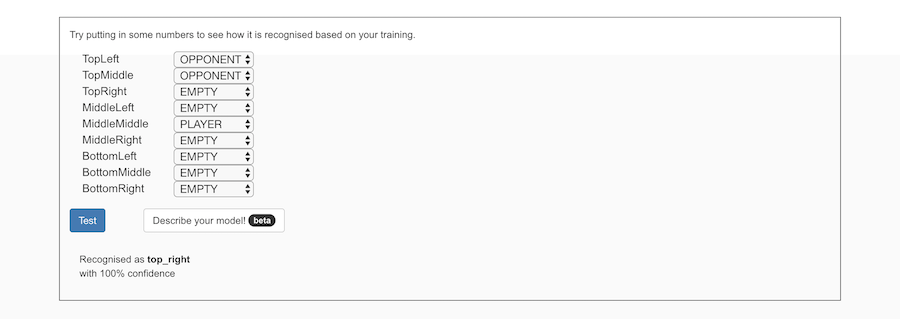
So nought goes in the centre space, which is followed by cross going in the top-middle space.
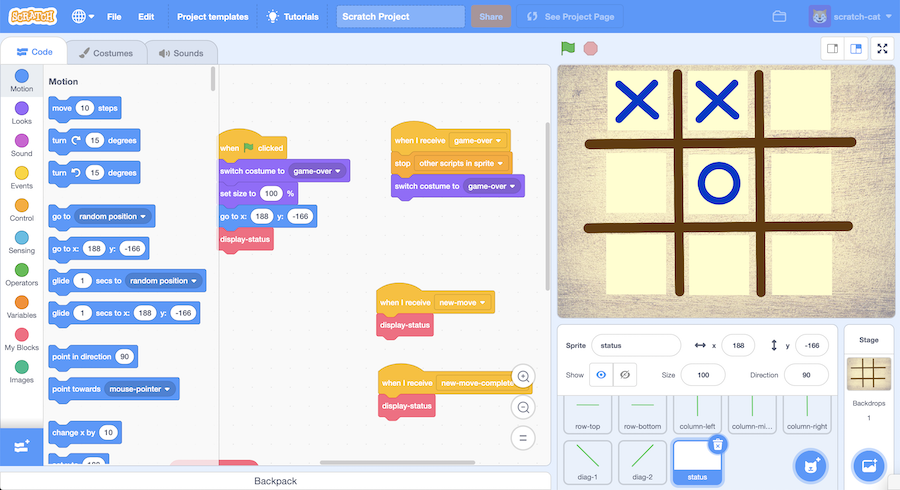
This time, my machine learning model predicts that noughts should go in the top-right.
And now students can see why.
Titanic passengers
Finally, you can use this with the Titanic passenger data that I’ve written about before.
Students can import a set of training data describing passengers on the Titanic, sorted into whether or not they survived the sinking of the ship.
They can use this to train a predictive model that, given a description of a passenger, predicts whether they would have been likely to survive.
(Yes, I still have the same uneasy qualms about this project…)
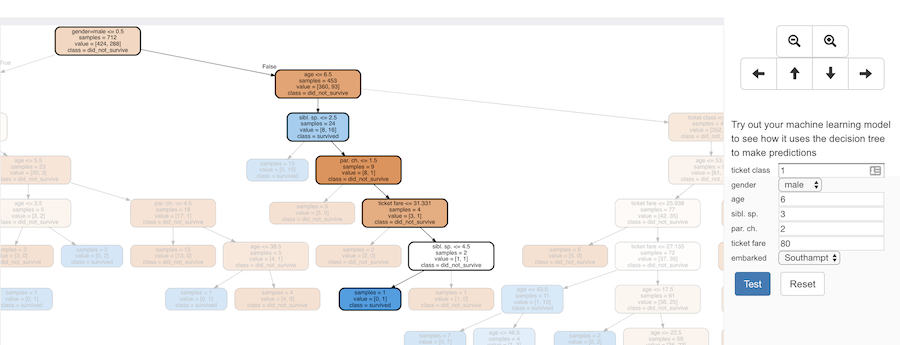
The visualization for this model is a thing of beauty.
And it makes it easier to see what patterns the machine learning model has identified in the training data.
Making a prediction that a six-year old boy travelling with three brothers and sisters and two parents would likely have survived.
Or a prediction that a 28-year-old woman travelling alone on a third-class ticket would also likely have survived.
What next?
This is still, at best, an early beta. I’m sure there are rough edges, I know it doesn’t cope well with very large training sets, I need to find a better way of explaining it, I want to improve the way that the tests for each node are described, and much more.
As a start, I’m very happy with it. As always, any suggestions and feedback are always welcome.
Tags: machine learning, mlforkids-tech









Dale, what you’ve done is of big help to better understand ML and to not think about it as a “black box”. This is just what we were waiting for!!!
I also think that the way this has been explained is very smart since you start with an easy but understandable example (how to “read” the visualization), and then move forward to a more complex one.
I know this is a lot of work, I would only add a more theoretical explanation of how these decision trees actually work. I know in ML there is a lot of math that may be difficult to understand by kids, but maybe we can still explain the main methodology/strategy using some variables or highlighting the logic (and the steps followed in order to achieve the tree) instead of the full math. I believe that’s something that would complement these lessons in a great way. Thanks!!!