How to use Scratch to create a visualization that explains what parts of an image a TensorFlow image classifier finds the most significant.
An image classifier recognizes this image as an image of The Doctor.
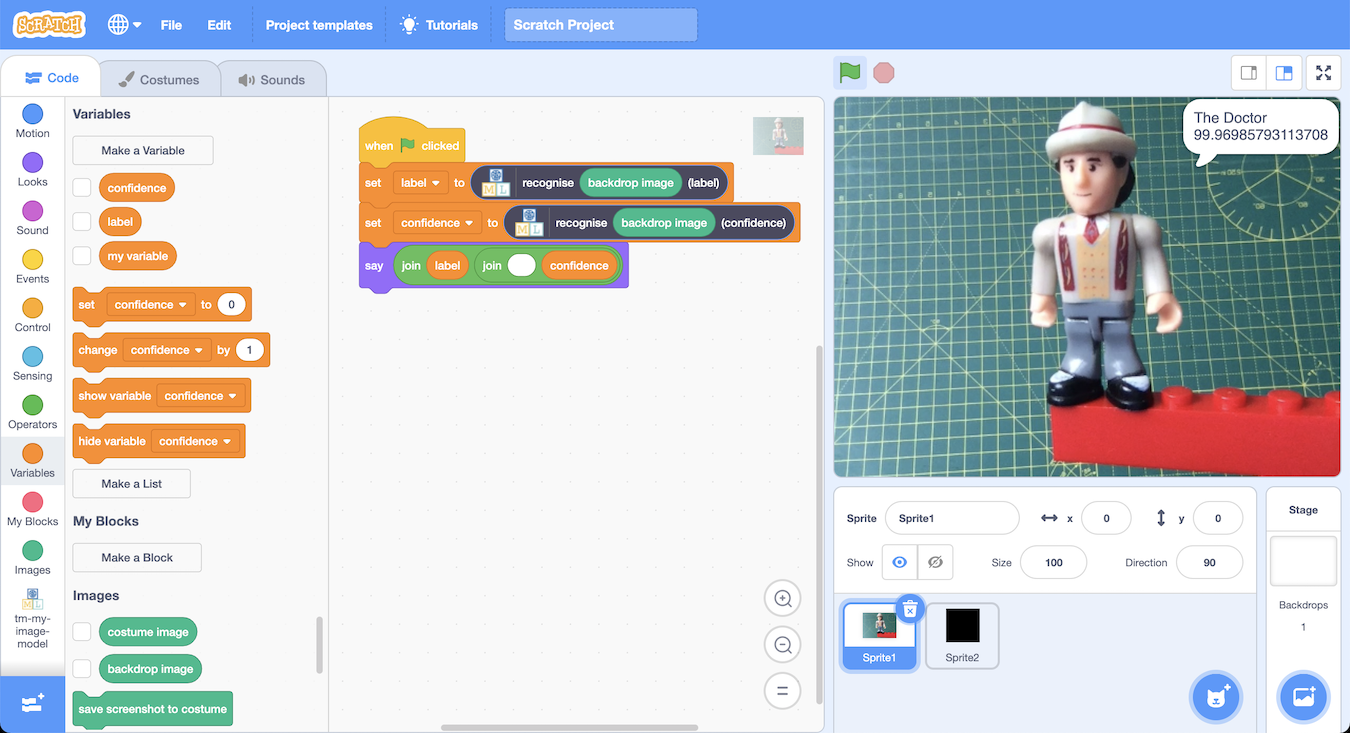
prediction: The Doctor
confidence: 99.97%
Why? What parts of the image did the classifier recognize as indicating that this is the Doctor?
How could we tell?
One idea could be to cover part of the image and see what difference it makes.
For example, if I cover part of the background, the image classifier still recognizes this as The Doctor, and the confidence has hardly changed.

prediction: The Doctor
confidence: 99.98%
The image classifier probably didn’t find the content of that part of the image very significant.
If I cover the face, the image classifier still recognizes it as the Doctor, but it is a bit less confident.
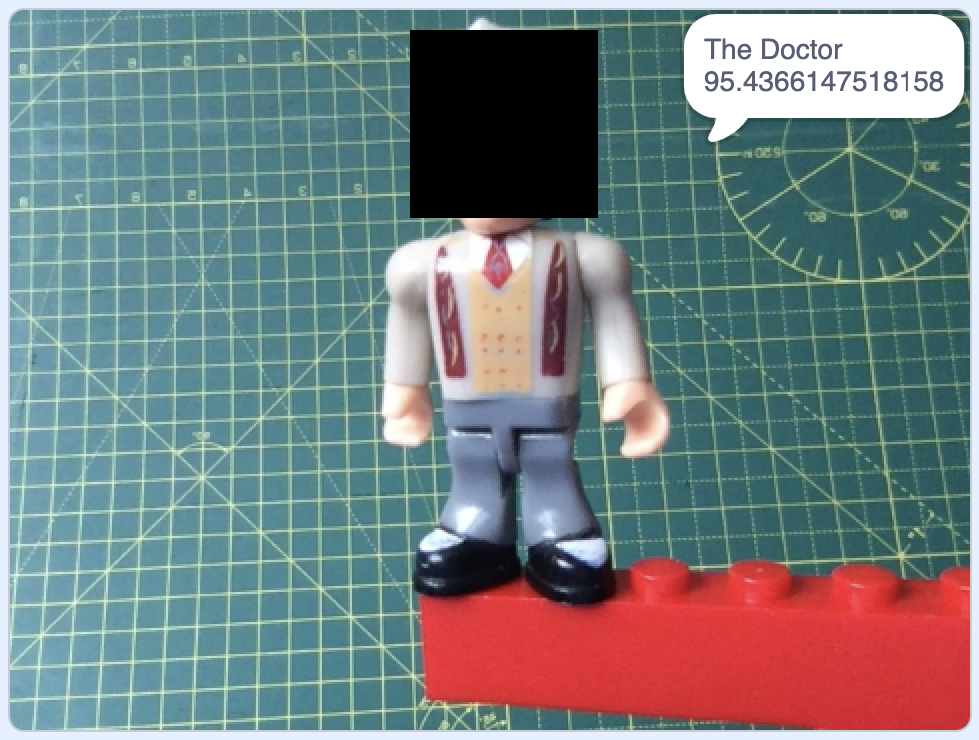
prediction: The Doctor
confidence: 95.44%
The face isn’t essential. The rest of the body is still enough to identify The Doctor. But the contents of that part of the image must have some significance, because the image classifier was less confident without it.
Another example – what if I cover the chest?

prediction: The Doctor
confidence: 78.41%
Still recognized as the Doctor, but much less confident. The contents of that section of the image must be very significant.
The right leg?
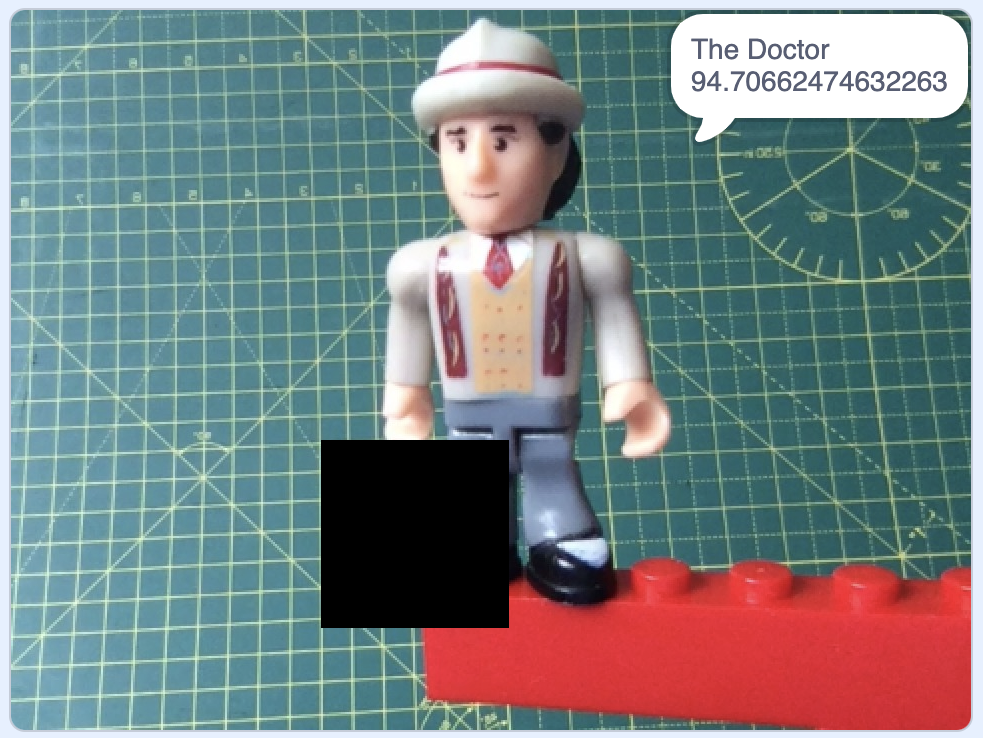
prediction: The Doctor
confidence: 94.71%
A little relevant – loses 5% confidence.
The left leg?
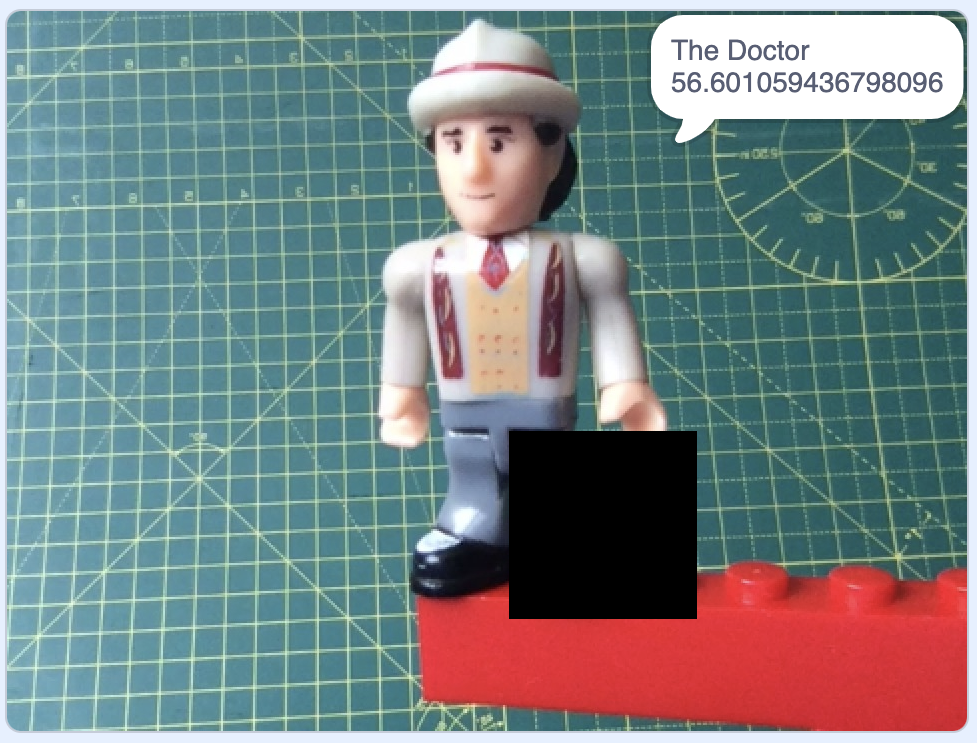
prediction: The Doctor
confidence: 56.60%
Very significant! This has had the biggest impact on the confidence so far.
Is it the leg? The shiny shoe?
I like this approach as a simple, intuitive way of testing an image classifier.
Displaying confidence numbers for one section of the image at a time is a bit slow. Better to have a way to visualize the change in confidence numbers for all the areas of the image.
I can vary the transparency of the black square as a way of visualizing the impact on the classifier’s confidence.
Setting the ghost effect to 0 means no transparency – the square appears black.
Setting the ghost effect to 100 means full transparency – the square cannot be seen any longer.
Using the ghost effect to visualize the difference:

Small difference to the image classifier’s confidence = small ghost value = the square displayed as black
High difference to the image classifier’s confidence = high ghost value = the square appears more see-through.
(I set the square ghost effect set to 0 while measuring the image classifier confidence, and only set the ghost effect afterwards to visualize the results without the transparency effects affecting the measurements).
If I do this for every possible location of my black square, I get this:

The left and right side of the photo isn’t very relevant, the face and hat are quite significant, and his shiny left shoe is very significant.
I really like this.
Let’s try it with another image.
The image classifier recognizes this image as Gandalf.

If I cover up sections of the image in sequence, the change this makes to the confidence can be visualised like this:

I love that the top of his cane is significant.
One more.
The image classifier recognizes this as Peter Venkman.

Showing the impact that different sections of the image have on the image classifier’s confidence results in:

A bit surprising.
Is it the black “gloves” that the model is picking up on?
What now?
It’s a fun idea, but I’m not really sure what to do with it.
Obviously I started playing with this thinking it could form the basis of a new worksheet for Machine Learning for Kids. Teachers are always asking for ways to explain more about the results that machine learning models give, so I tried this as a way of being able to do that in a simple visual way using Scratch.
And while I find the output this makes interesting, I’m an unashamed geek. I’m not sure how to make an activity out of this that children would find interesting.
I’m open to suggestions. If you can think of a way of making this into a fun project, please let me know!
In the meantime, if you’d like to try the Scratch project I used for these screenshots, download image-classifier-relevance-demo.sb3 and open it using my modified version of Scratch. (Press the Green Flag then press the X key to run it)
If you’d like to create your own version of this with your own machine learning model and images, you can download the instructions.
Tags: machine learning, mlforkids-tech, scratch
Have you looked at the AIX360 toolkit?
https://github.com/Trusted-AI/AIX360
https://aix360.mybluemix.net/
Those links take a bit of digging around to work out so it’s easier if you have half an hour space to just watch this intro video https://youtu.be/Yn4yduyoQh4