In this post, I introduce a few core Flink SQL functions using worked examples of processing a stream of click tracking events from a retail website.
I find that a practical, real-world (ish) example can help to explain how to use Flink SQL in a way that abstract descriptions, such as processing coloured blocks sometimes doesn’t quite achieve.
I’ll use this post to give examples of my most-used Flink SQL functions, in the context of a retail scenario: a stream of events from customers on the website for a clothing retailer.
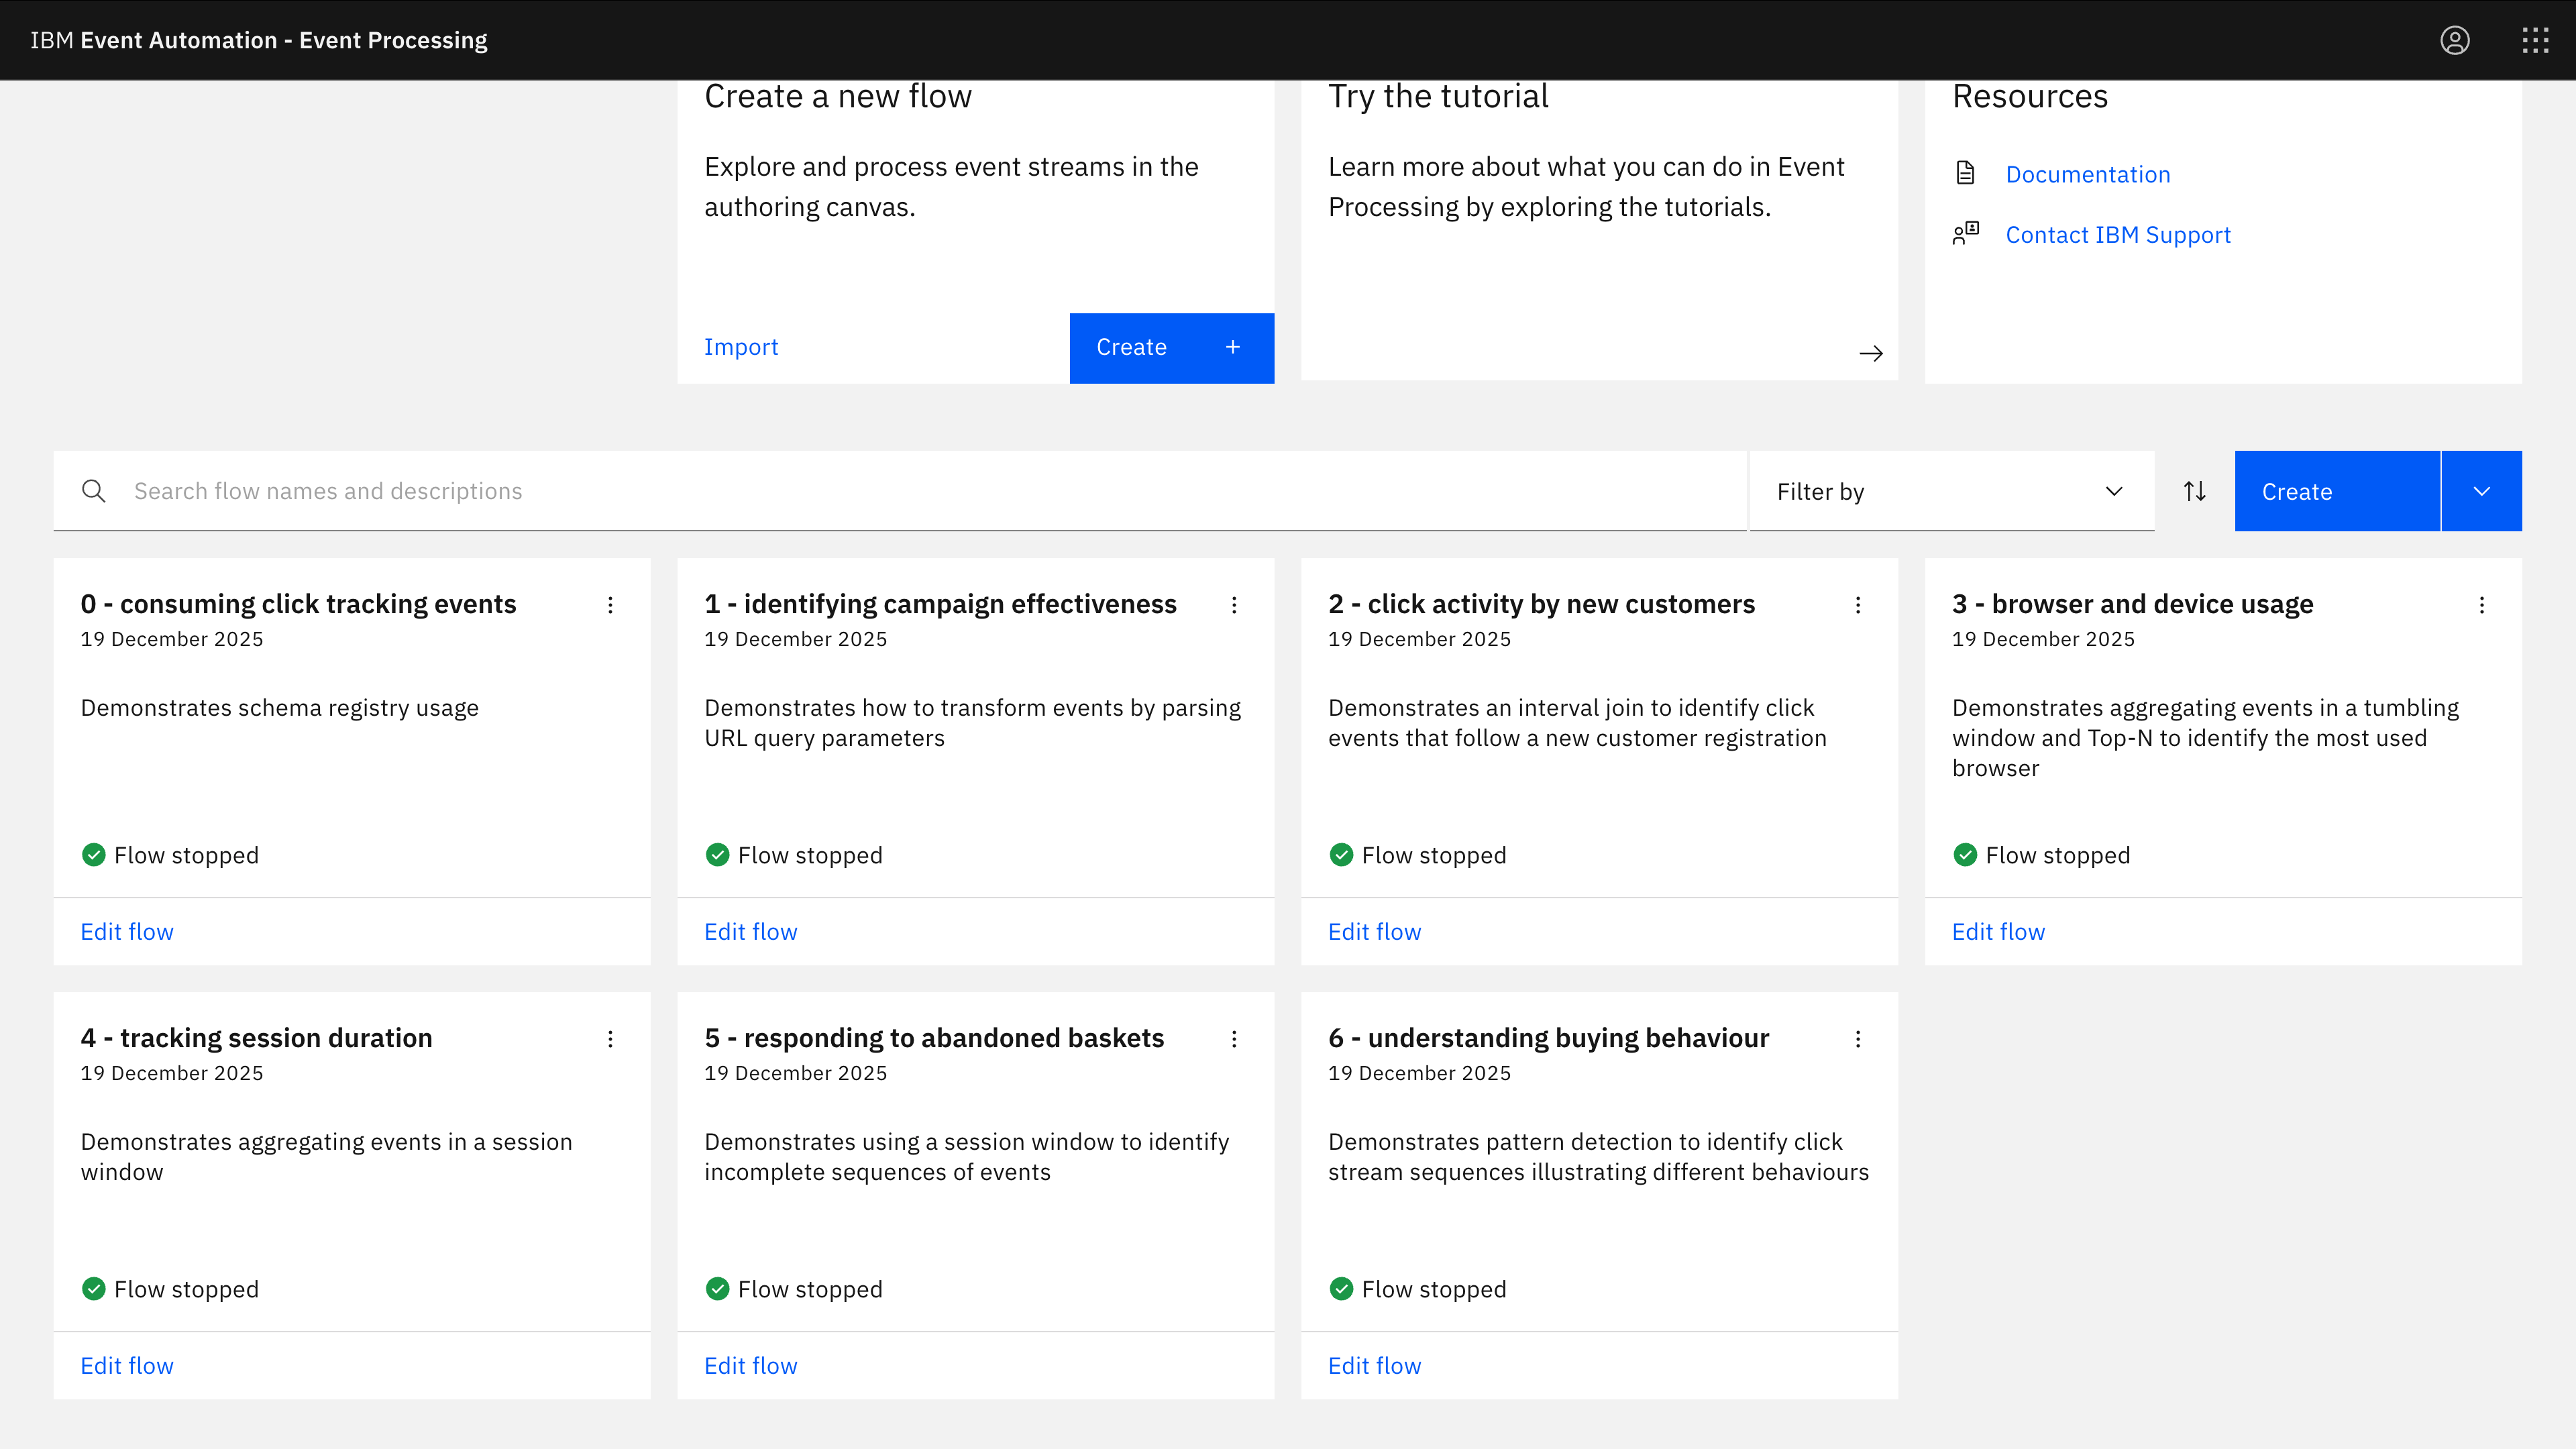
Note: I used Event Processing to create the flows, as the assistants in the canvas helped me create examples quickly. Everything I’ve created is standard Apache Flink SQL, so you don’t need to have Event Processing to try these examples.
- The examples:
- 0 Consuming Avro – bring click tracking events into Flink
- 1 Transforming – deriving new properties
- 2 Joining – correlating with related event streams
- 3 Aggregating (tumble) – counting in a tumble window
- 4 Aggregating (session) – counting in a session window
- 5 Aggregating (session) – collecting in a session window
- Data – the events I’m processing in these examples
- Setup – how to recreate this if you want to try this for yourself
0 Consuming click tracking events
Demonstrating how to consume Avro events and connect to a schema registry to fetch schemas as needed.
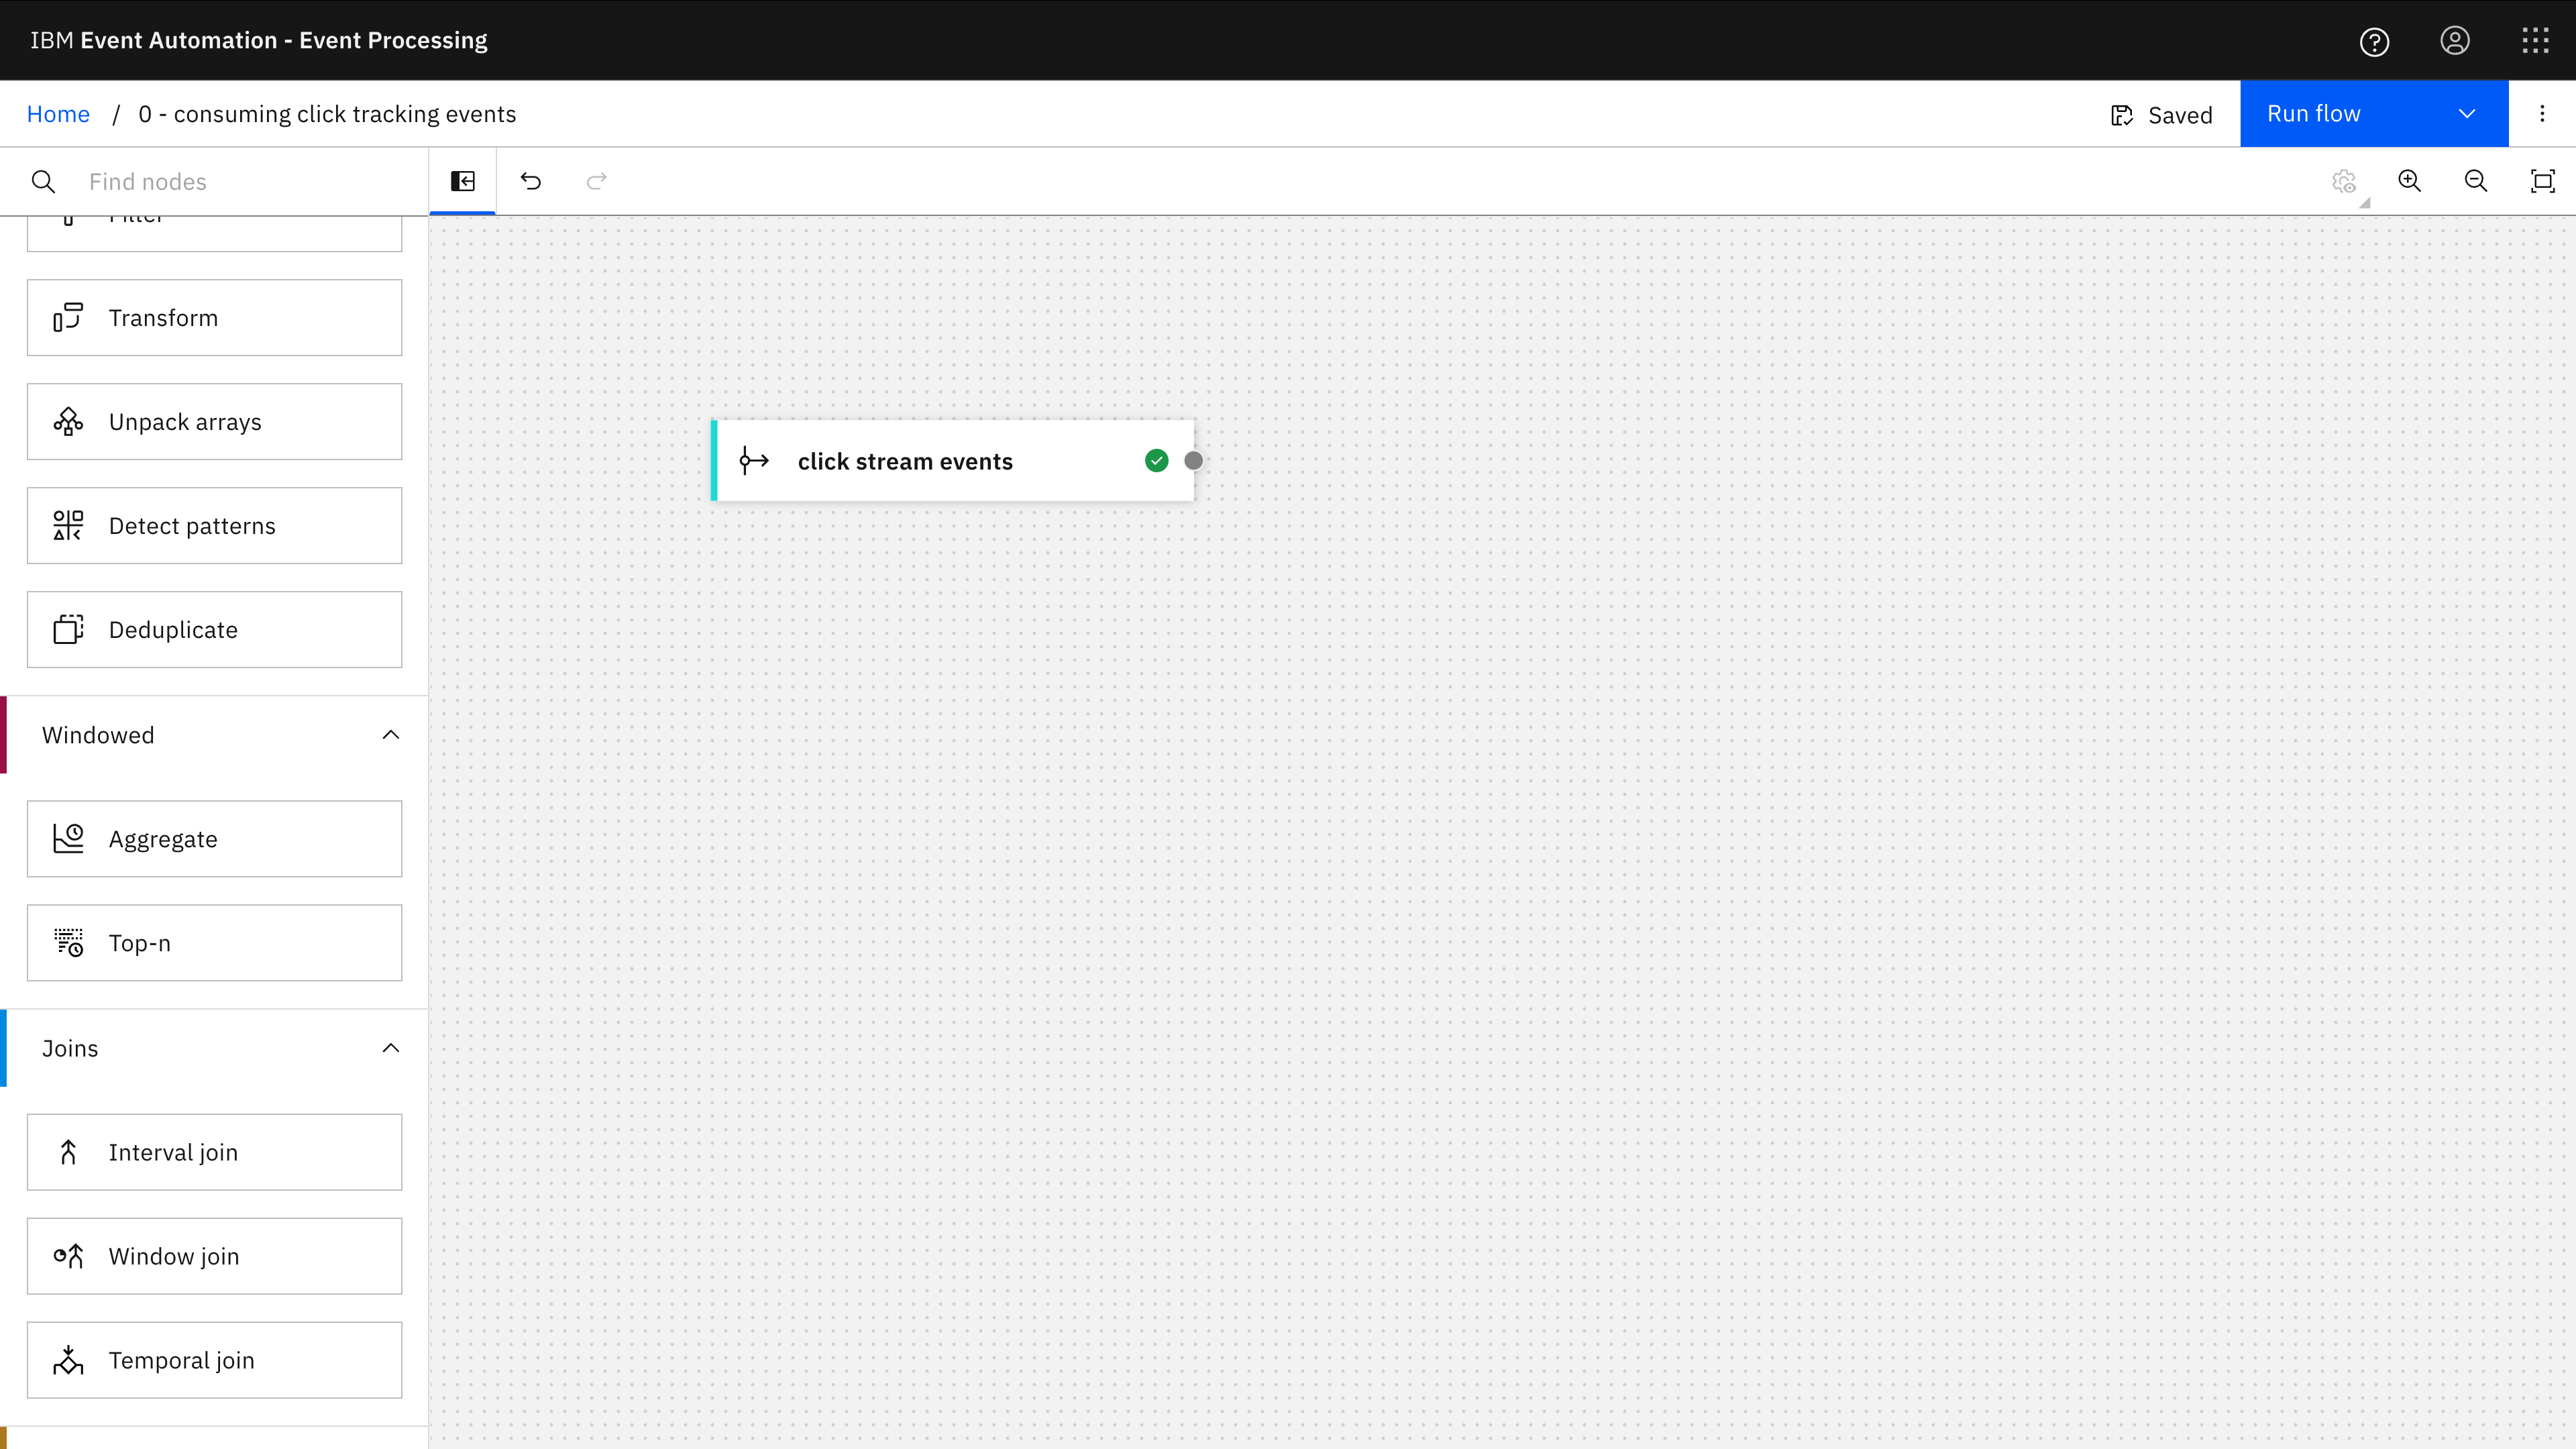
The Event Processing project for this example is just a single event source node.
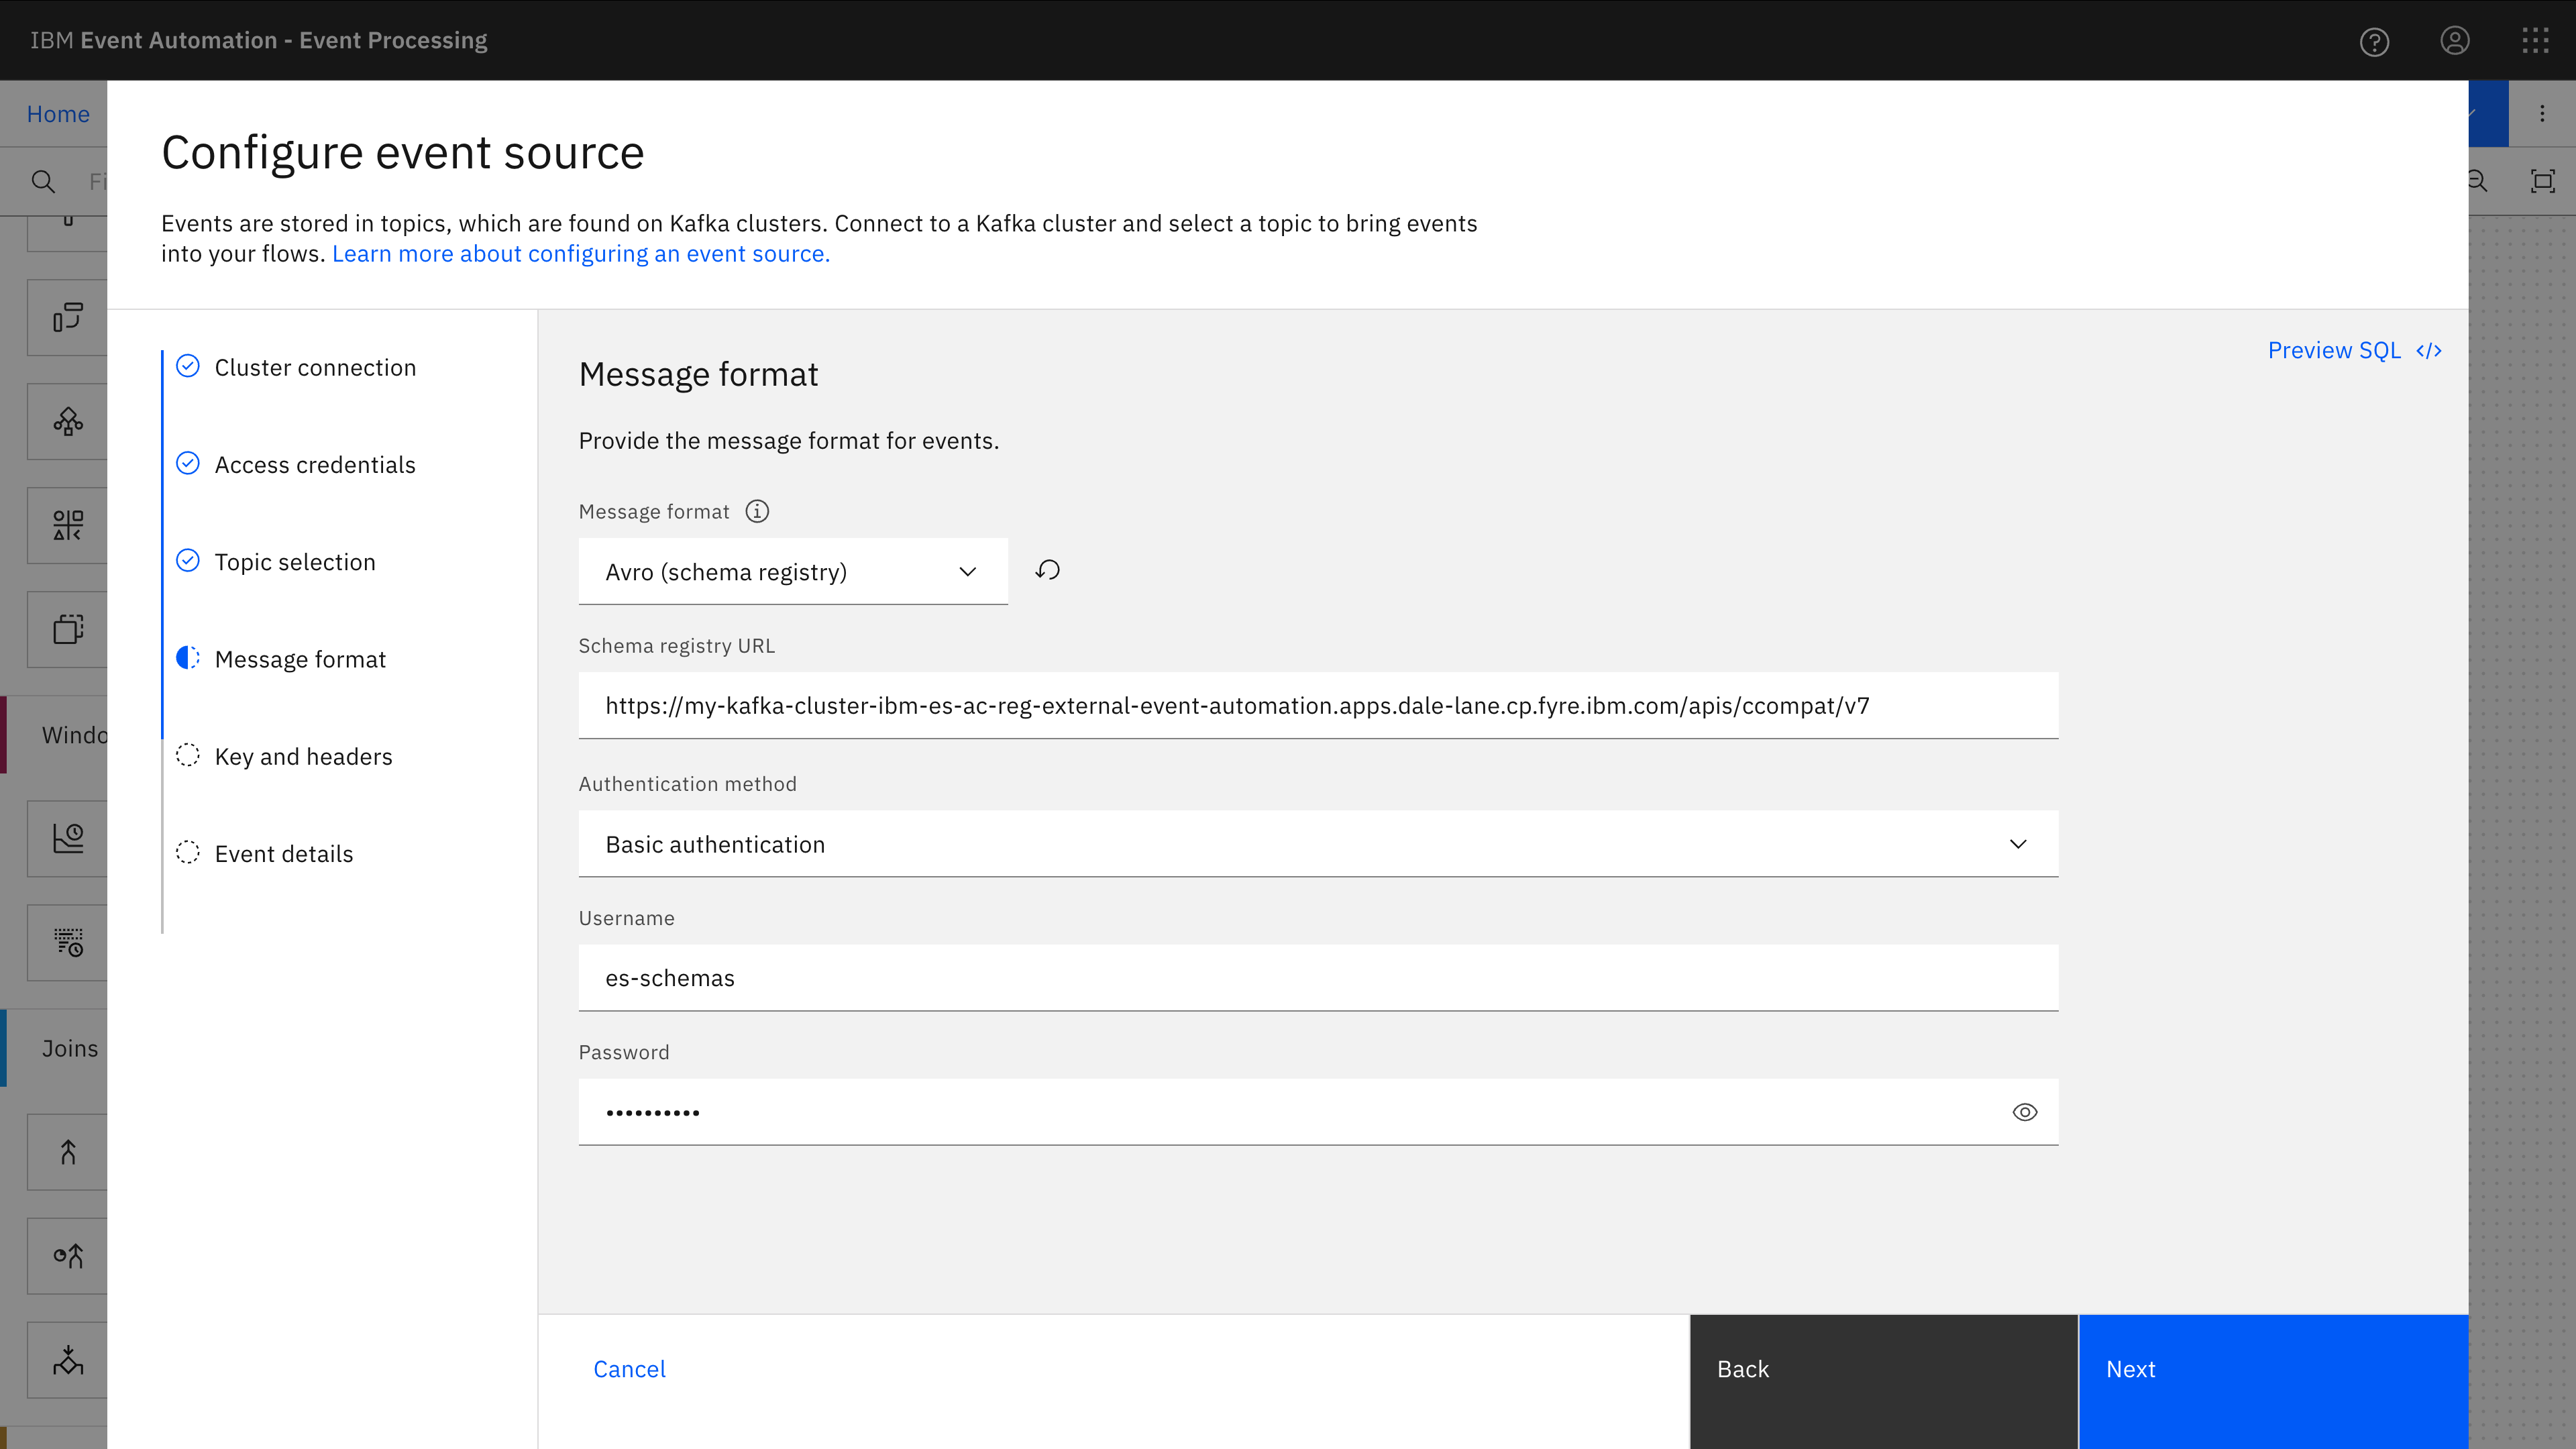
I want Flink to dynamically fetch schemas on-demand for the events that it consumes, so I provided connection details for a Confluent-compatible schema registry API.
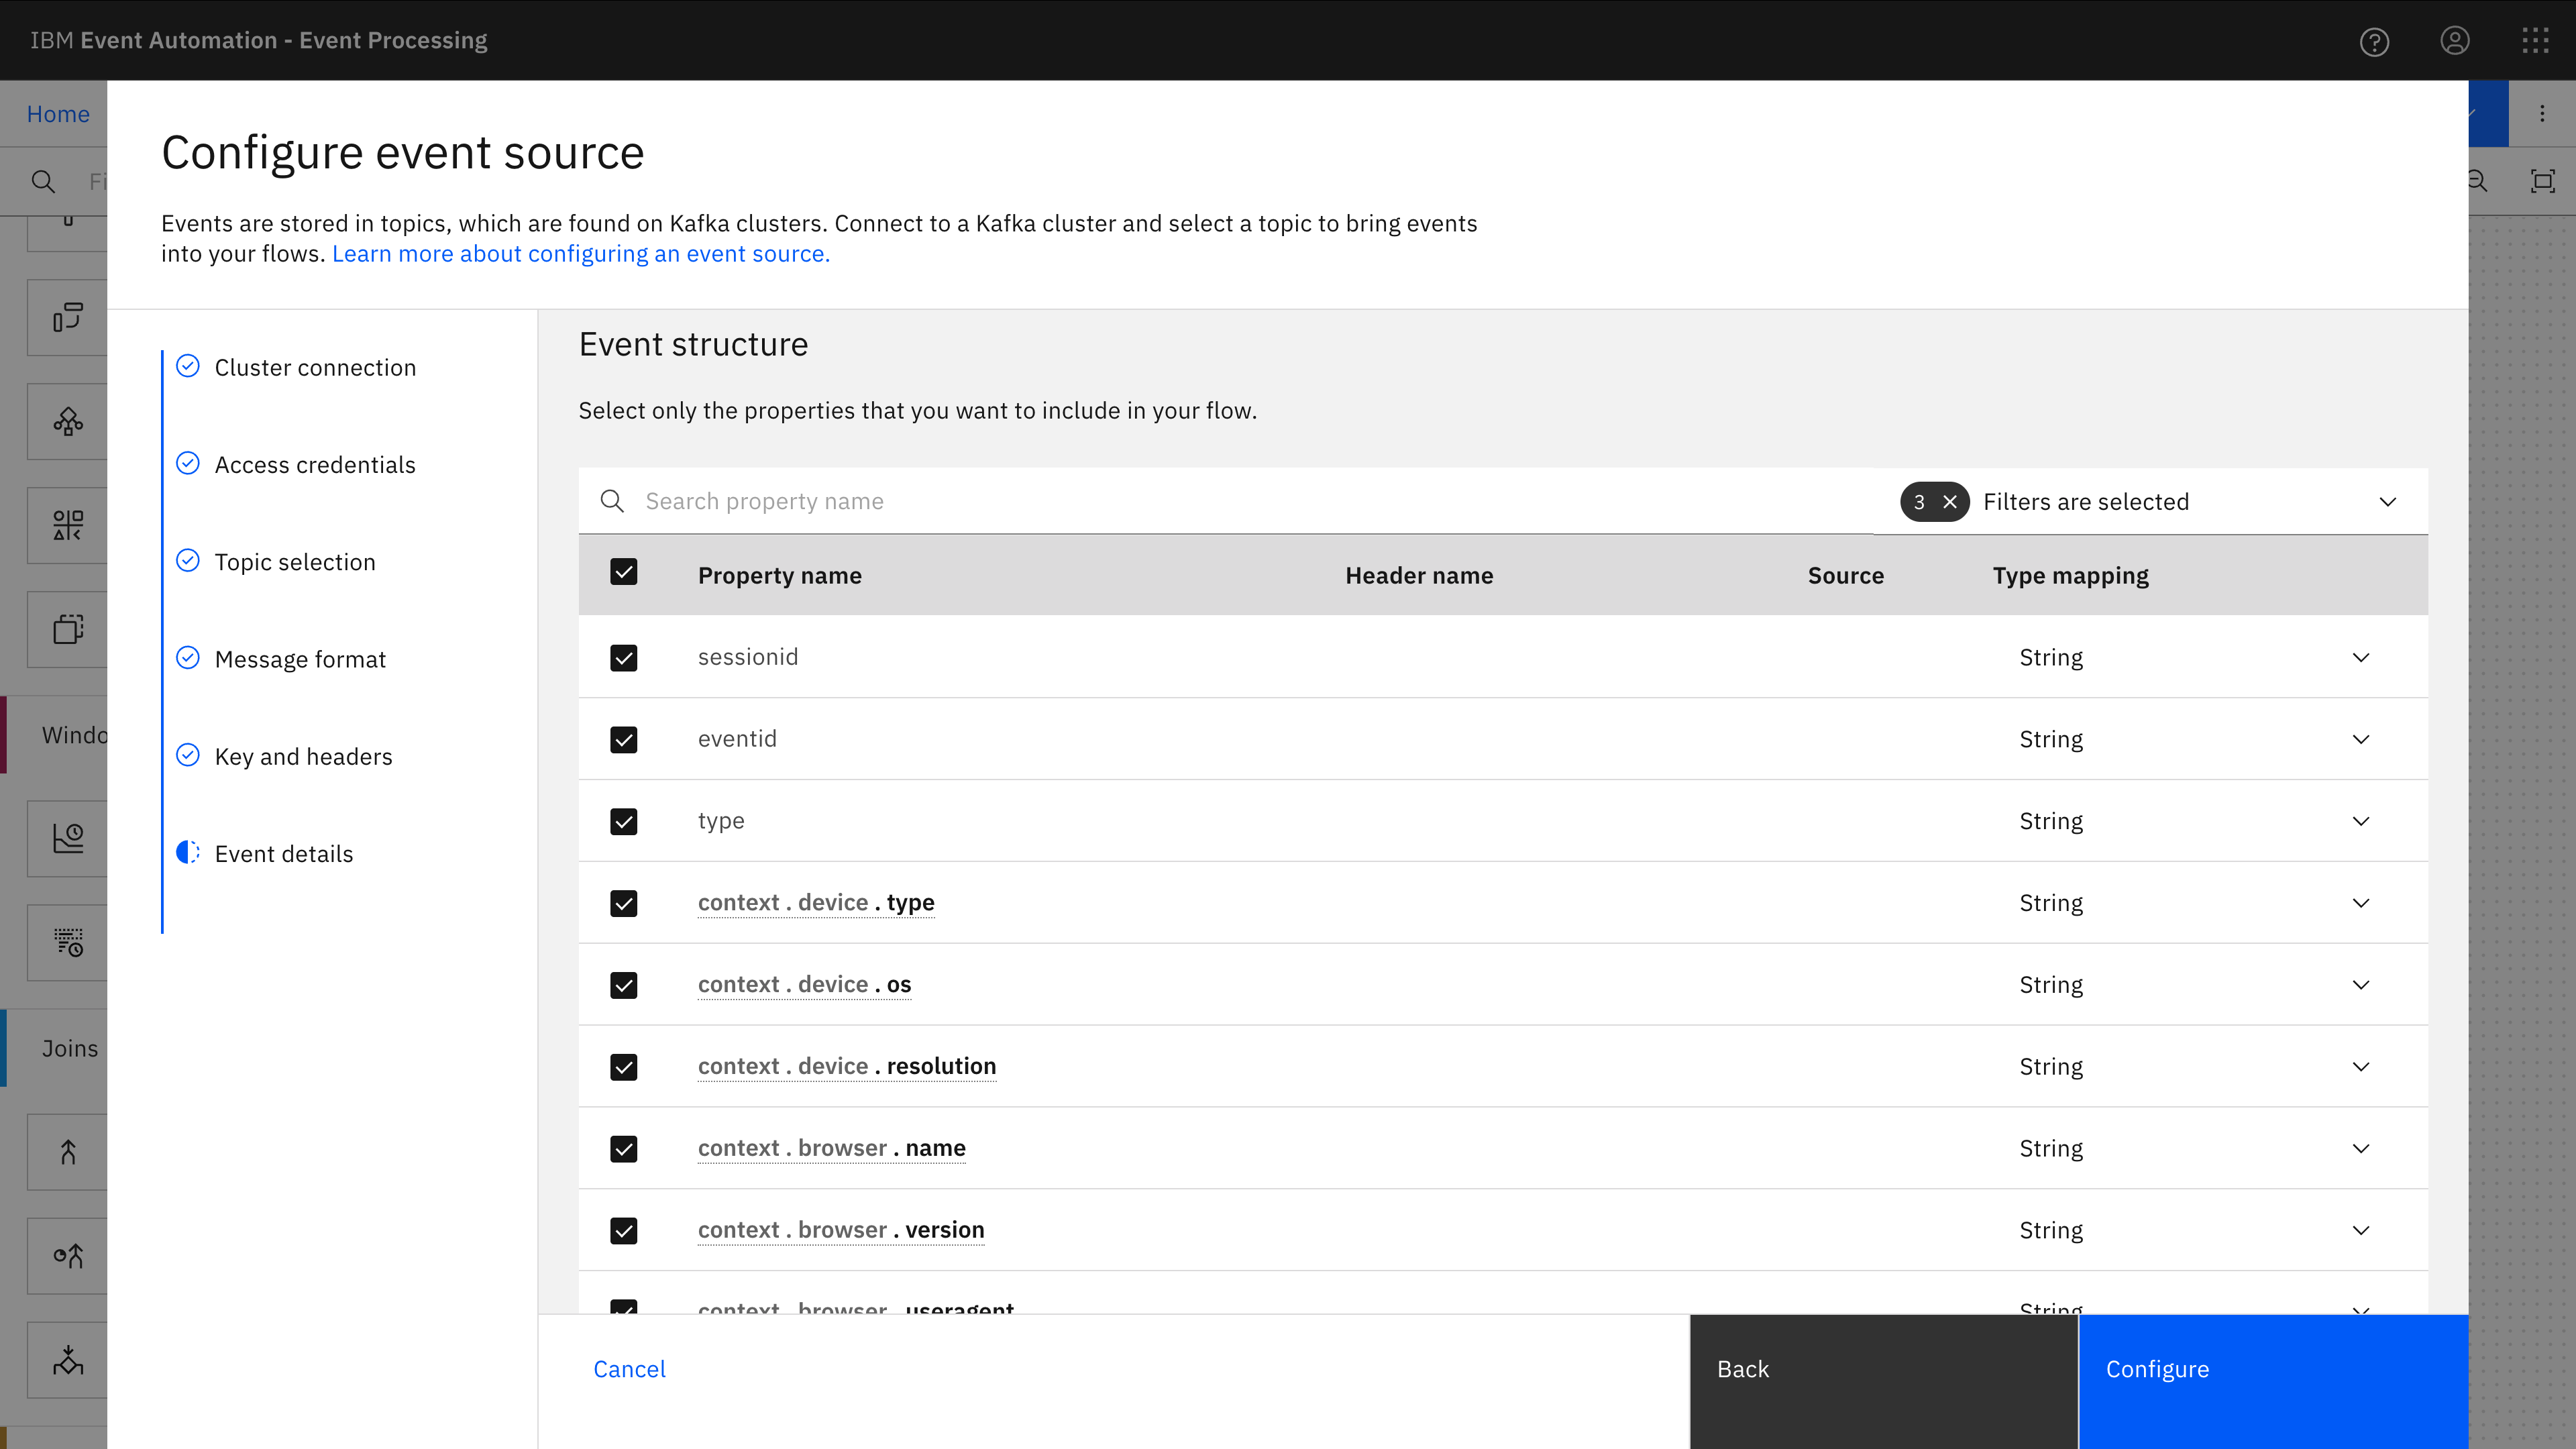
I still need to define the table for Flink, which Event Processing generated by fetching the current version of the schema for the topic and converting the Avro schema (see below) into the equivalent SQL table definition.
I’ve added a few comments to the SQL generated for this example for readability.
(If you use this, you’ll need to replace the password but otherwise that SQL will work as-is if you’ve used the same setup as me.)
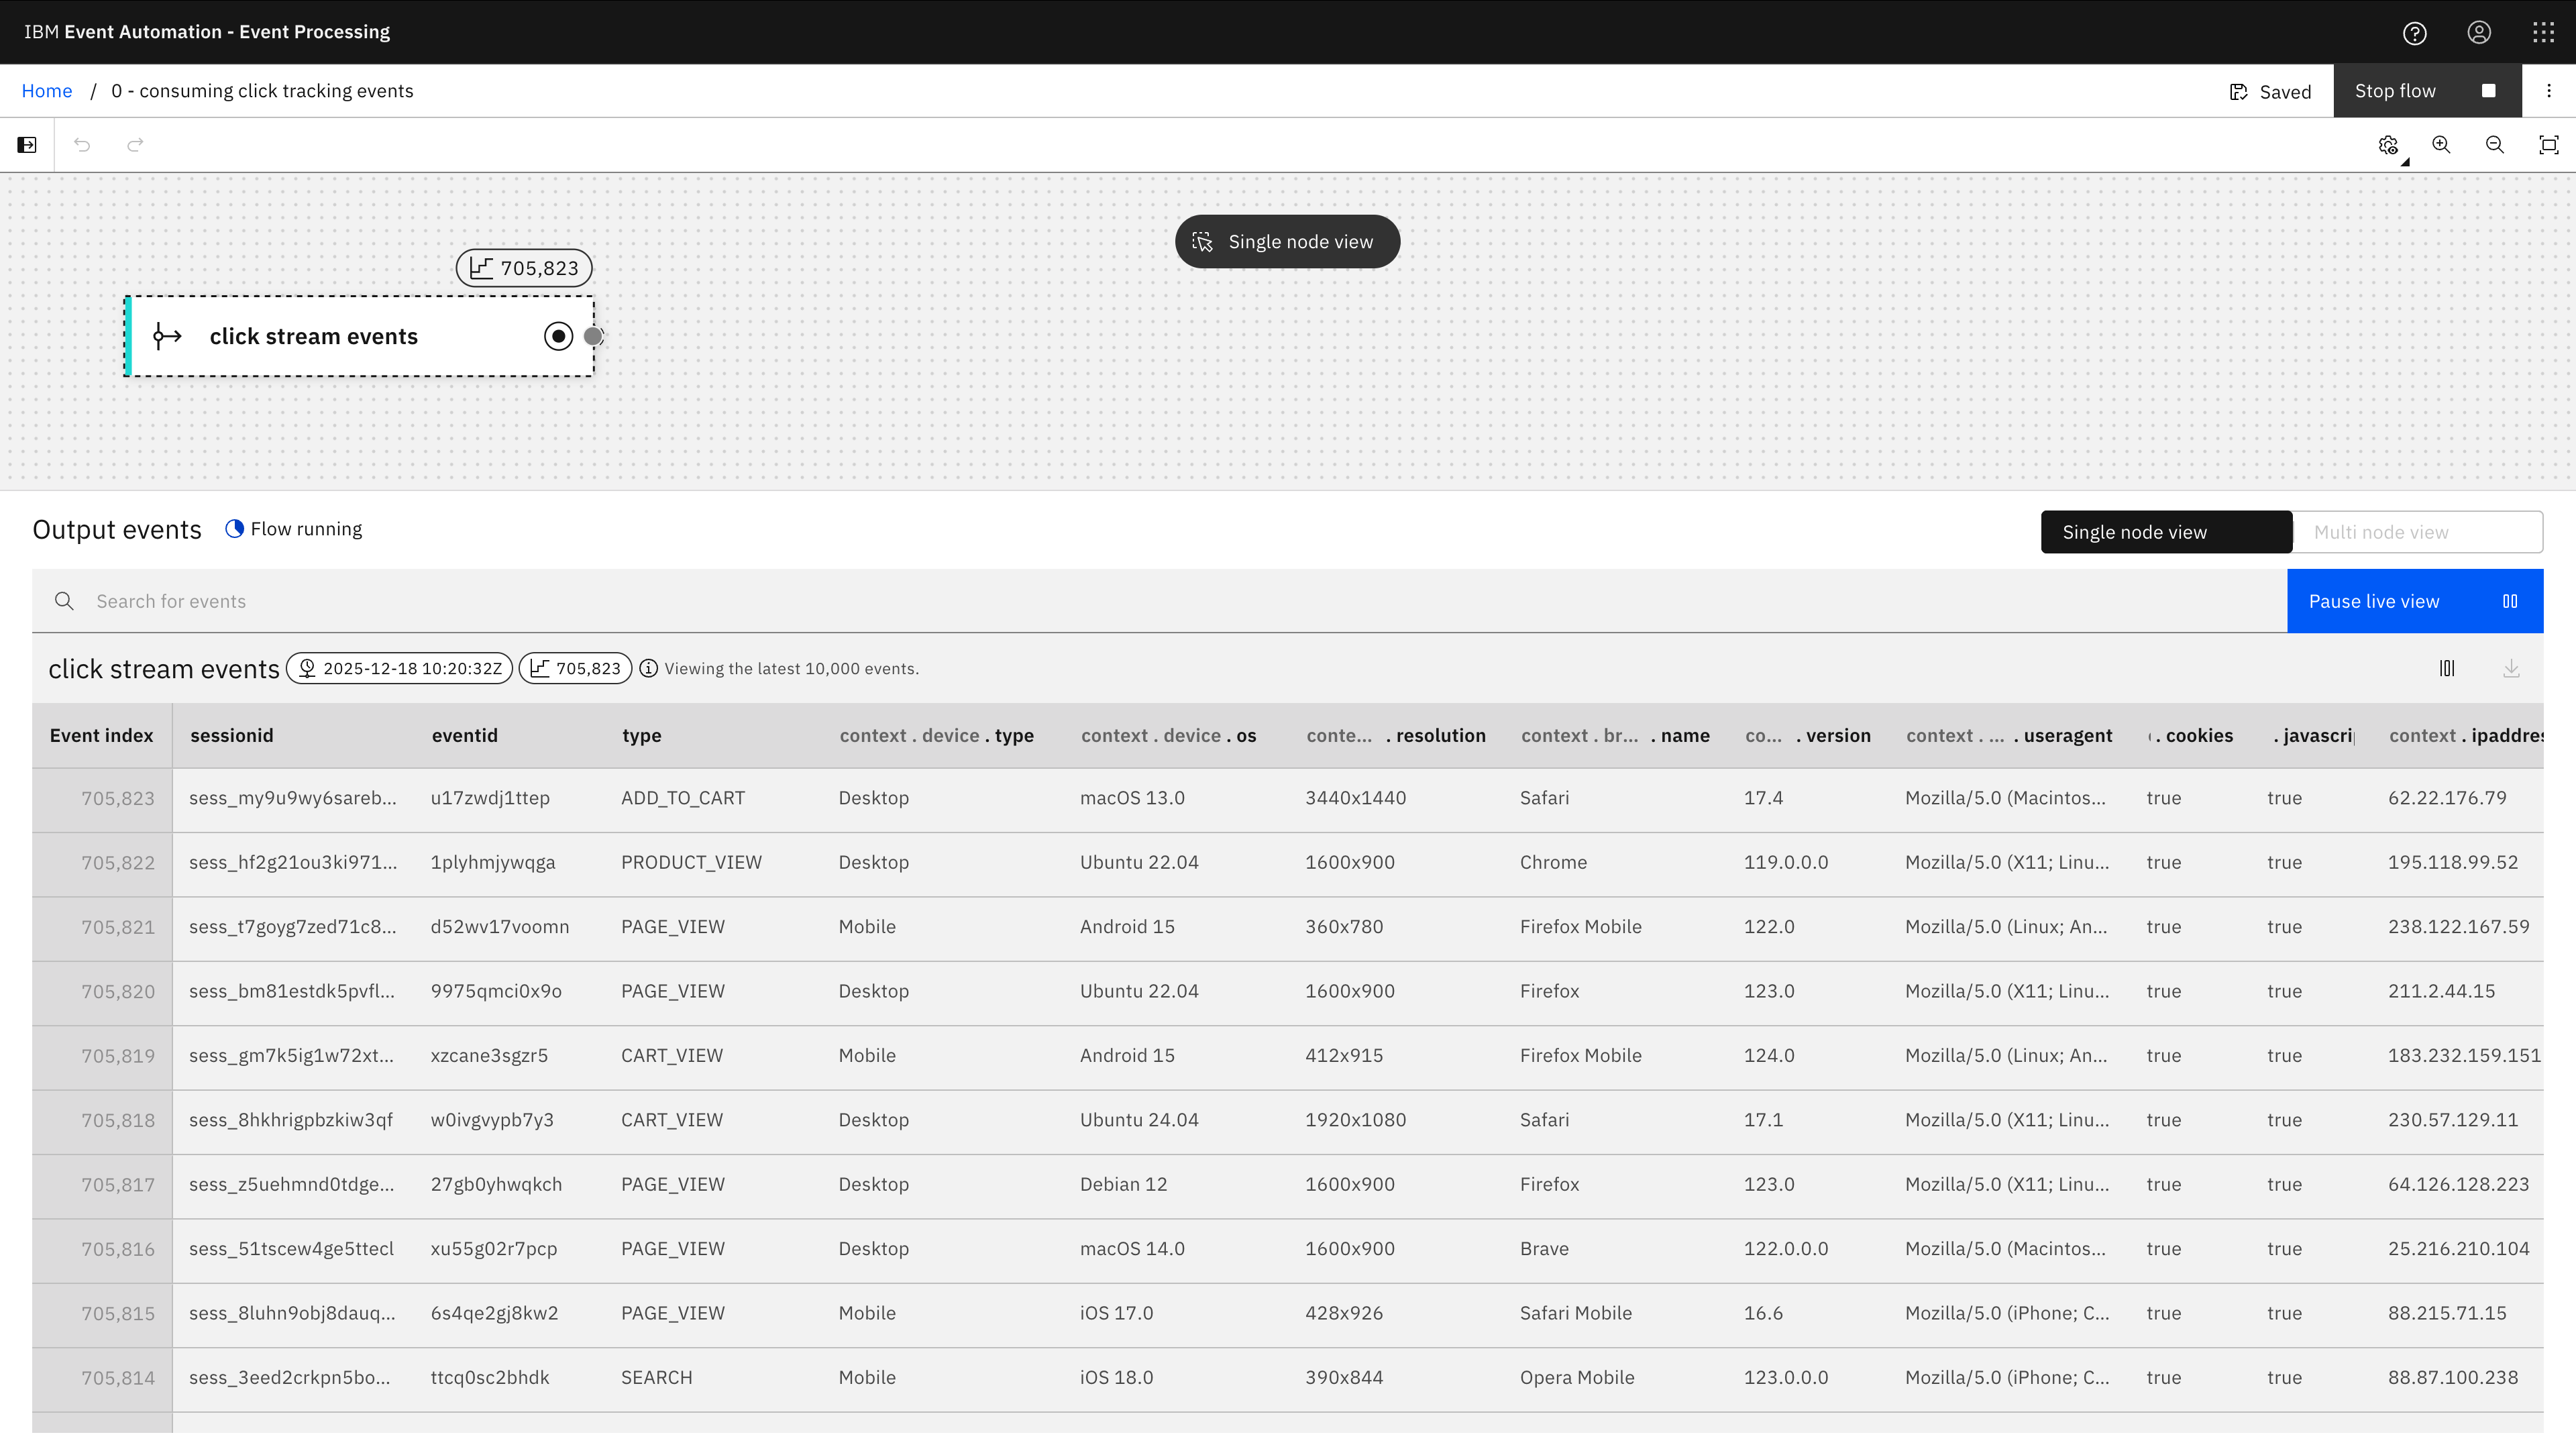
Running this SQL isn’t super exciting, but this is getting us started.
1 Identifying marketing campaign effectiveness
Demonstrating how to transform events by deriving marketing campaign properties from query parameters in click event URLs.
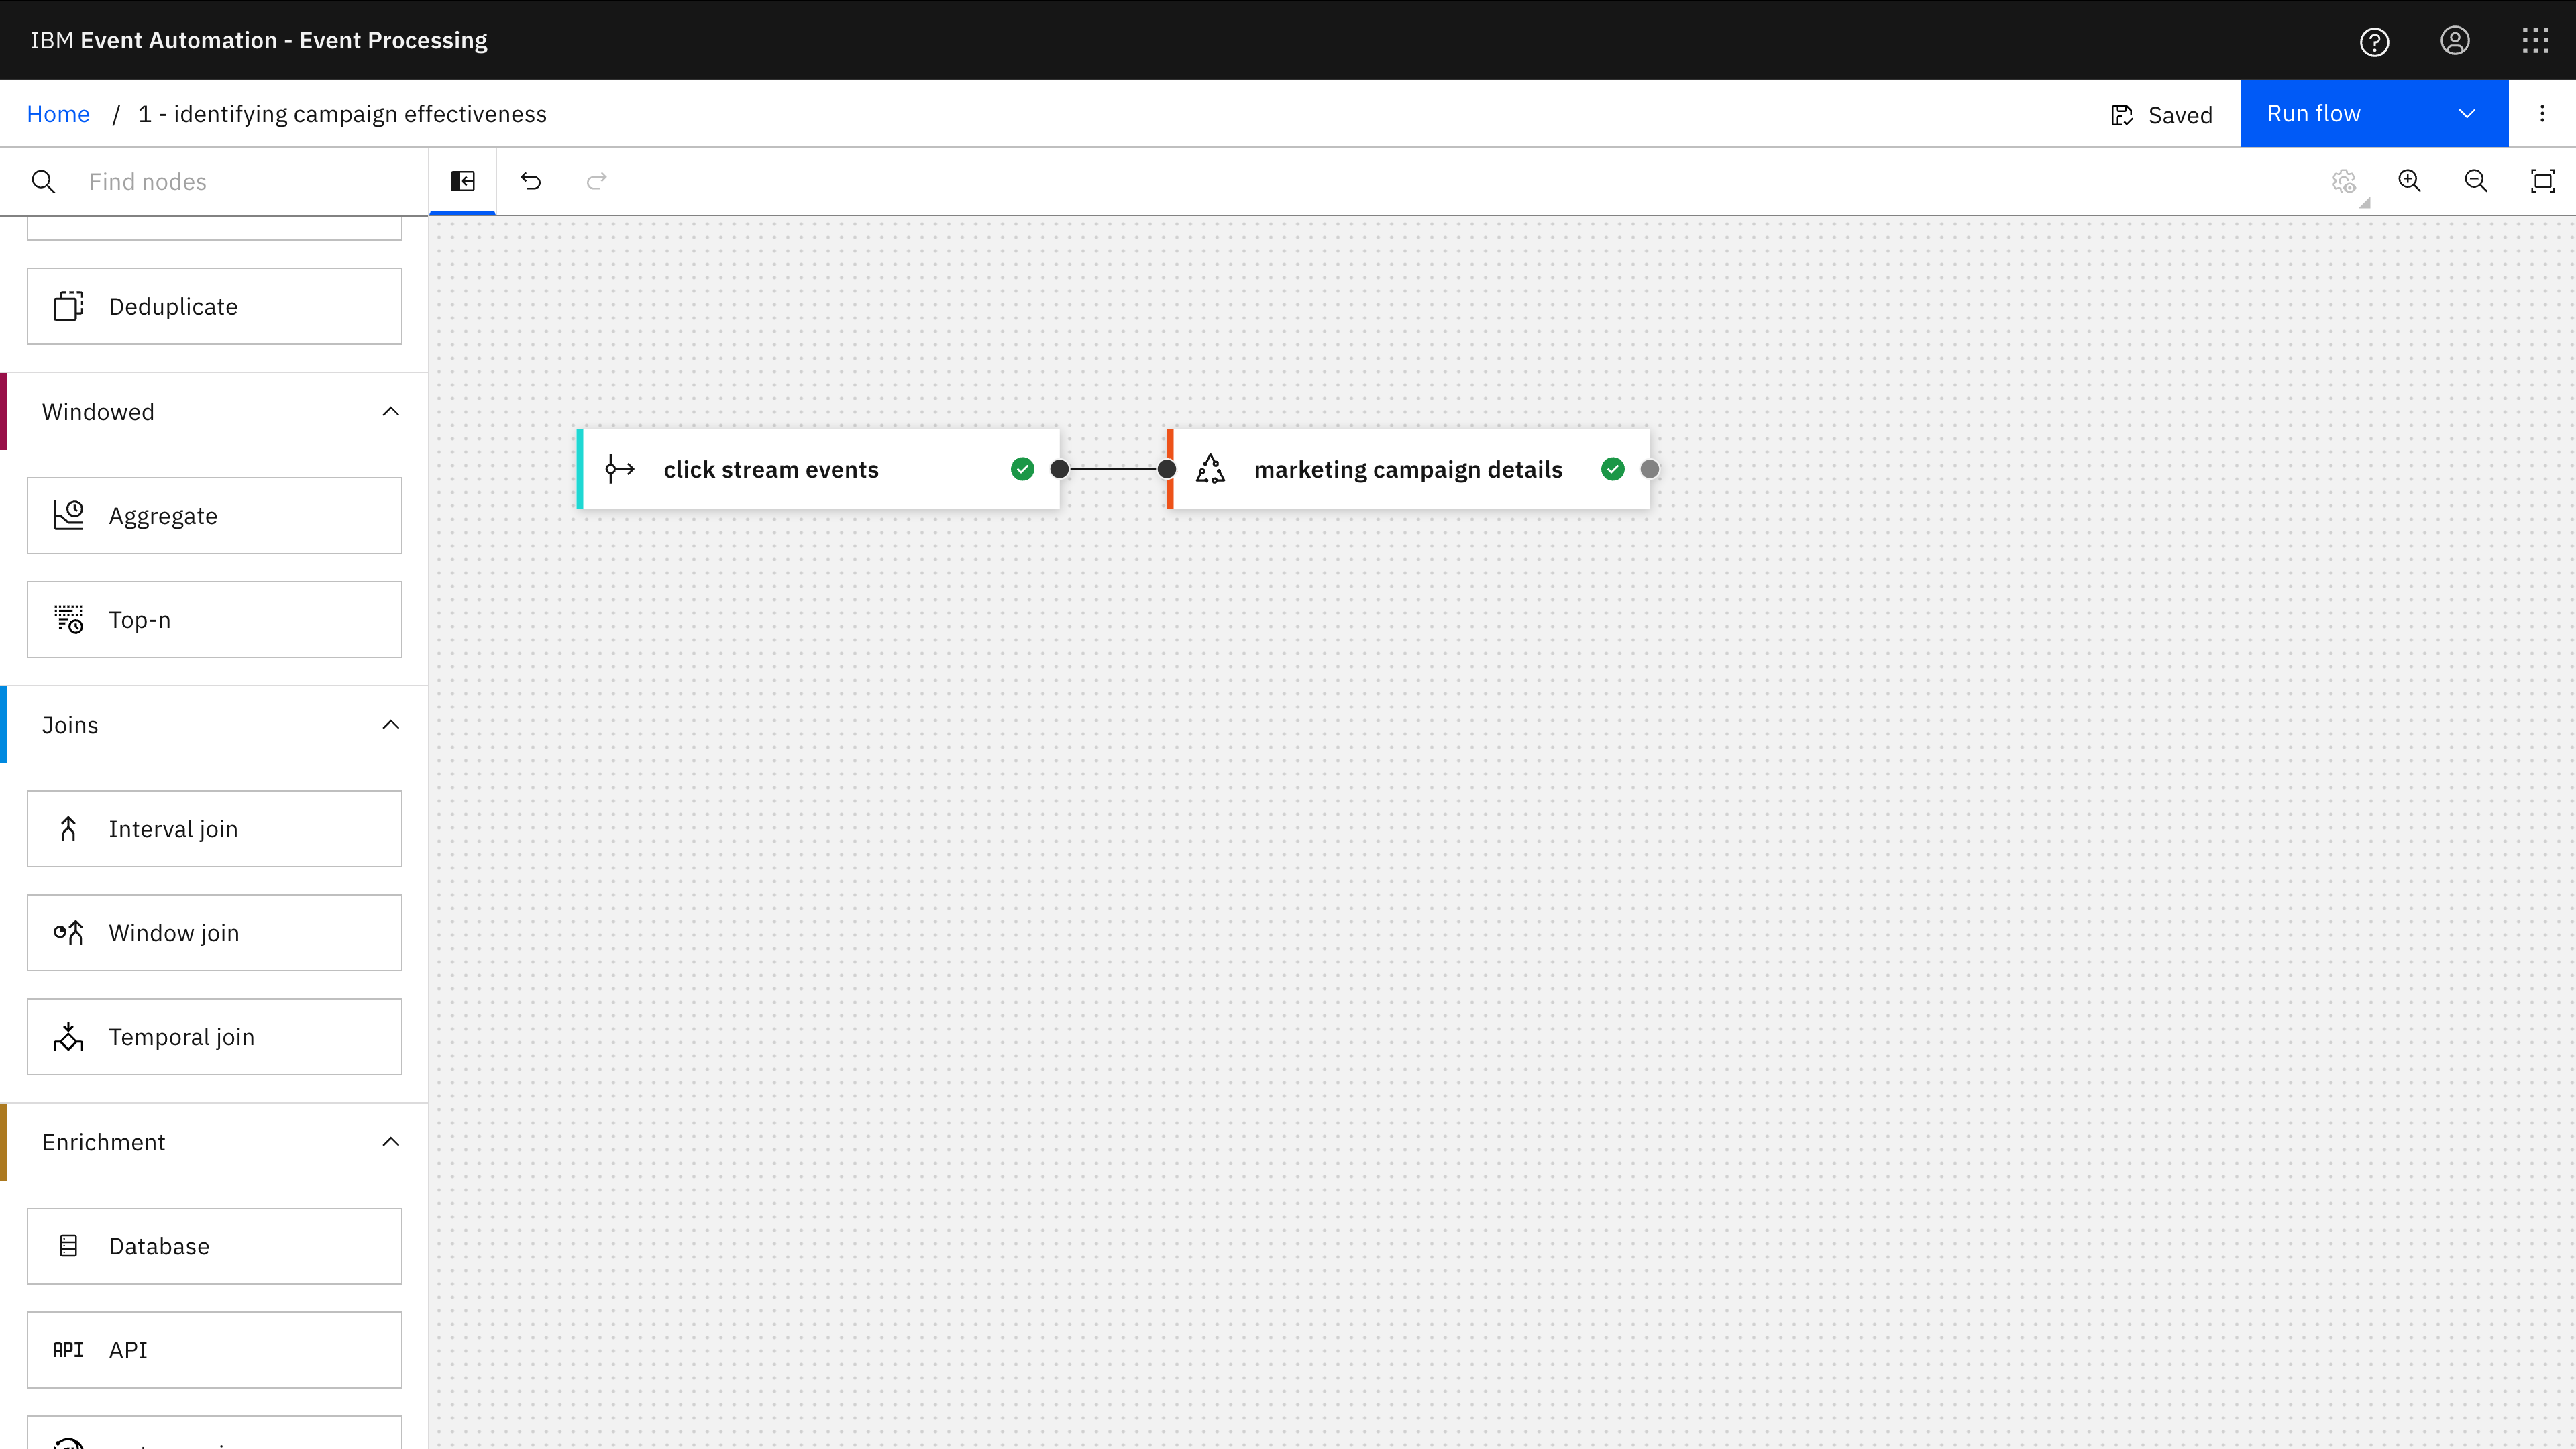
The Event Processing project for this builds on the previous example by adding a Transform node.
Click events contain the URL that was the origin of the click event. This example demonstrates how to use some of Flink’s built-in functions by chopping up that URL to extract marketing campaign properties.
The interesting bits are lines 91-96 which are a nice example of how Flink has functions to solve a wide variety of data parsing and processing use cases.
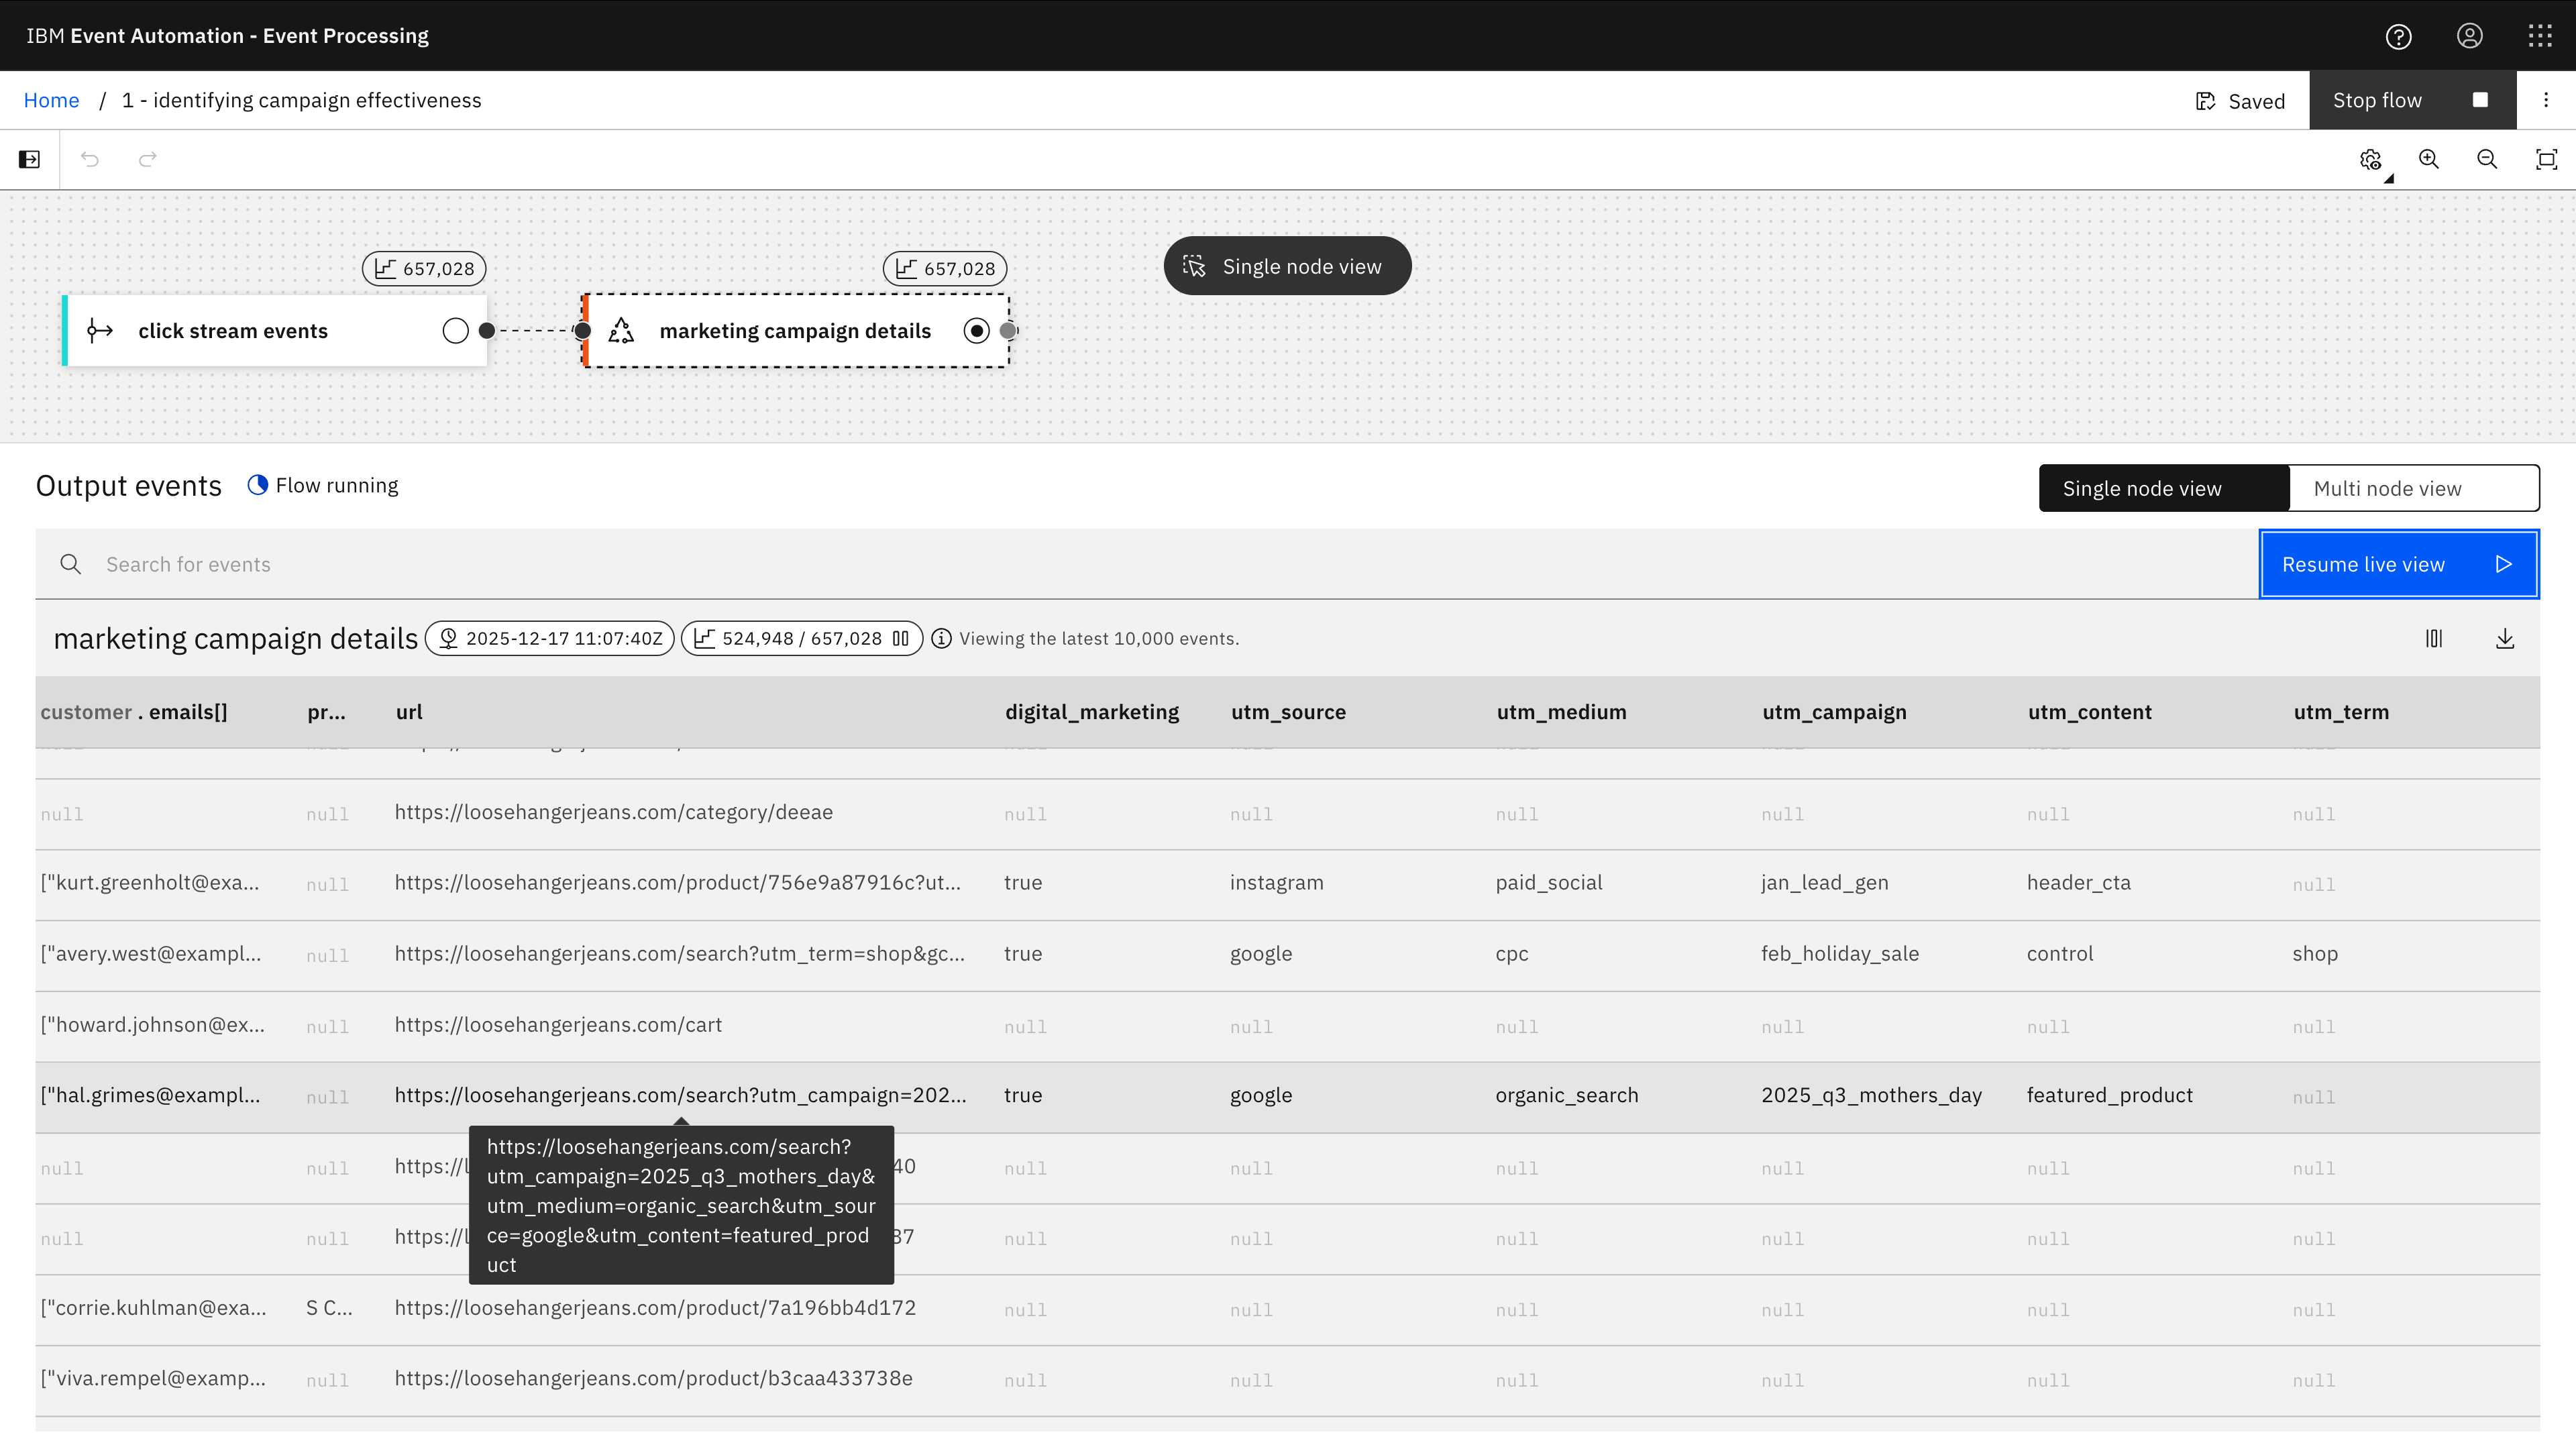
The screenshot above from running the flow in Event Processing shows a comparison between the raw URL from the click tracking event with the different utm_ parameters that it has extracted.
(Many of them are null because not all URLs include marketing campaign properties.)
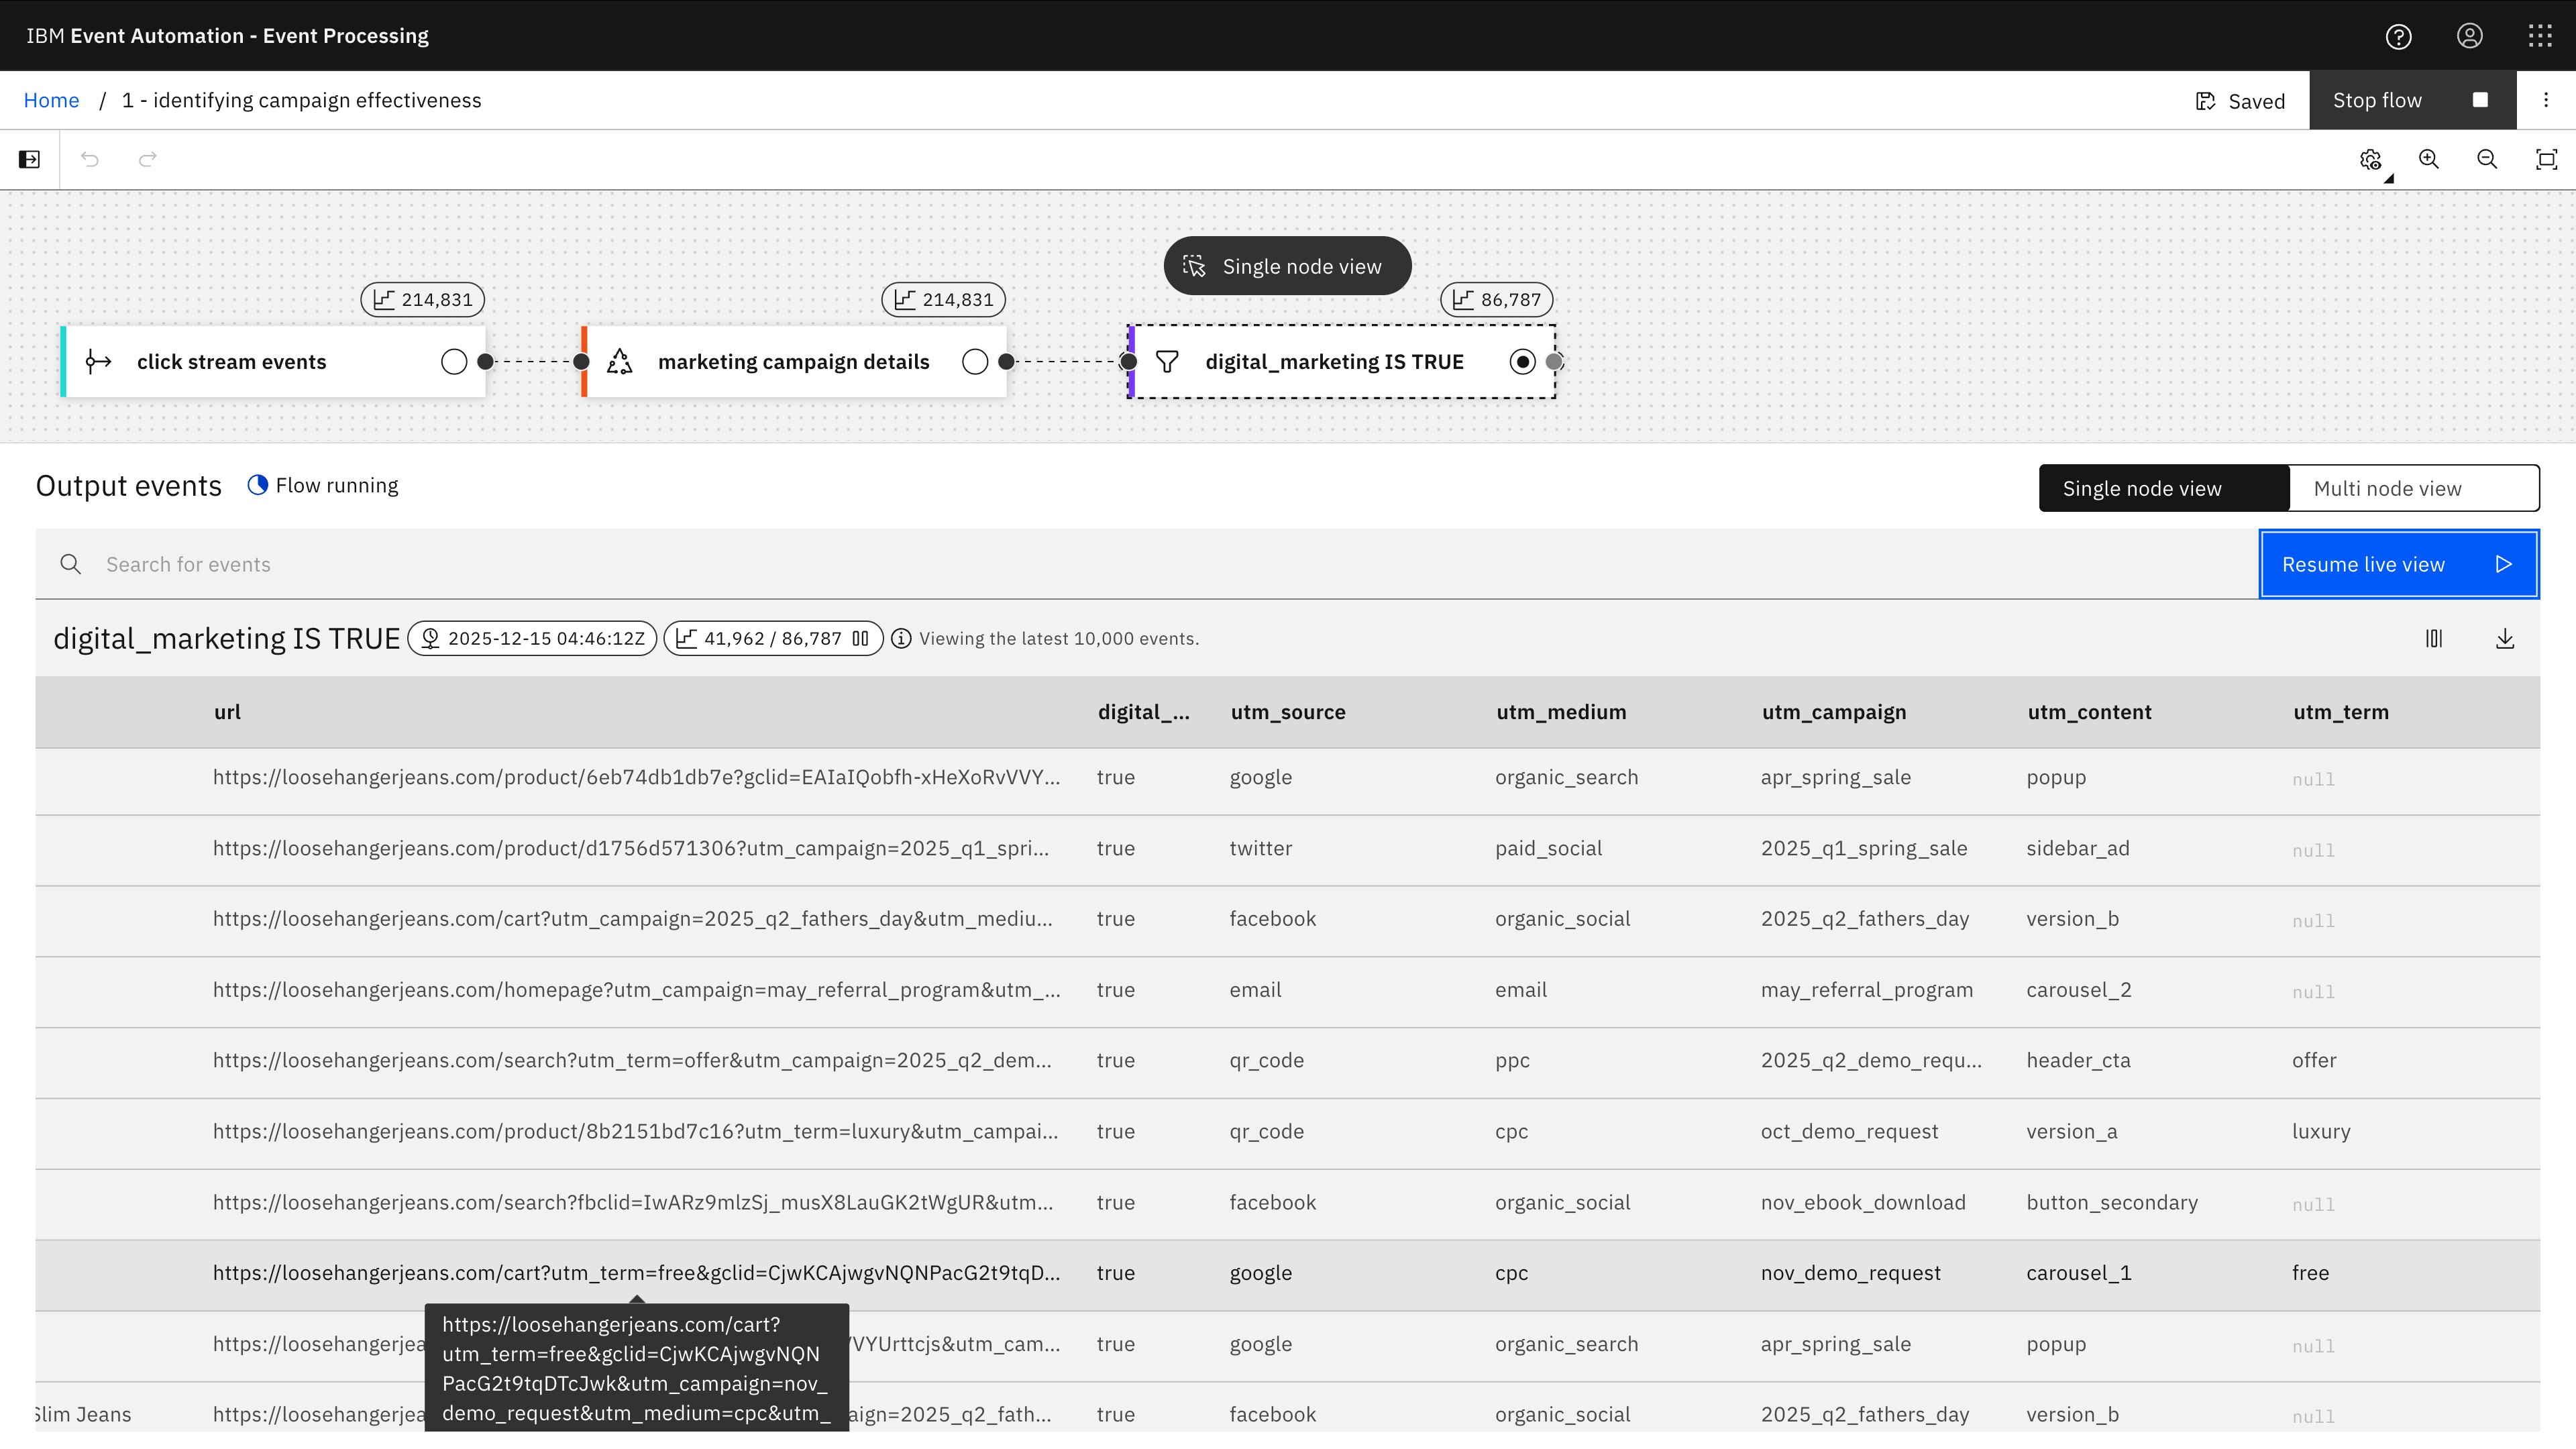
Adding an additional filter for digital_marketing IS TRUE lets me show only the click tracking events that contained a URL with marketing campaign properties.
2 Click tracking activity by new customers
Demonstrating an interval join to correlate between related streams of events, by identifying click tracking events that occur within a short time of a new customer registration event for the same user.
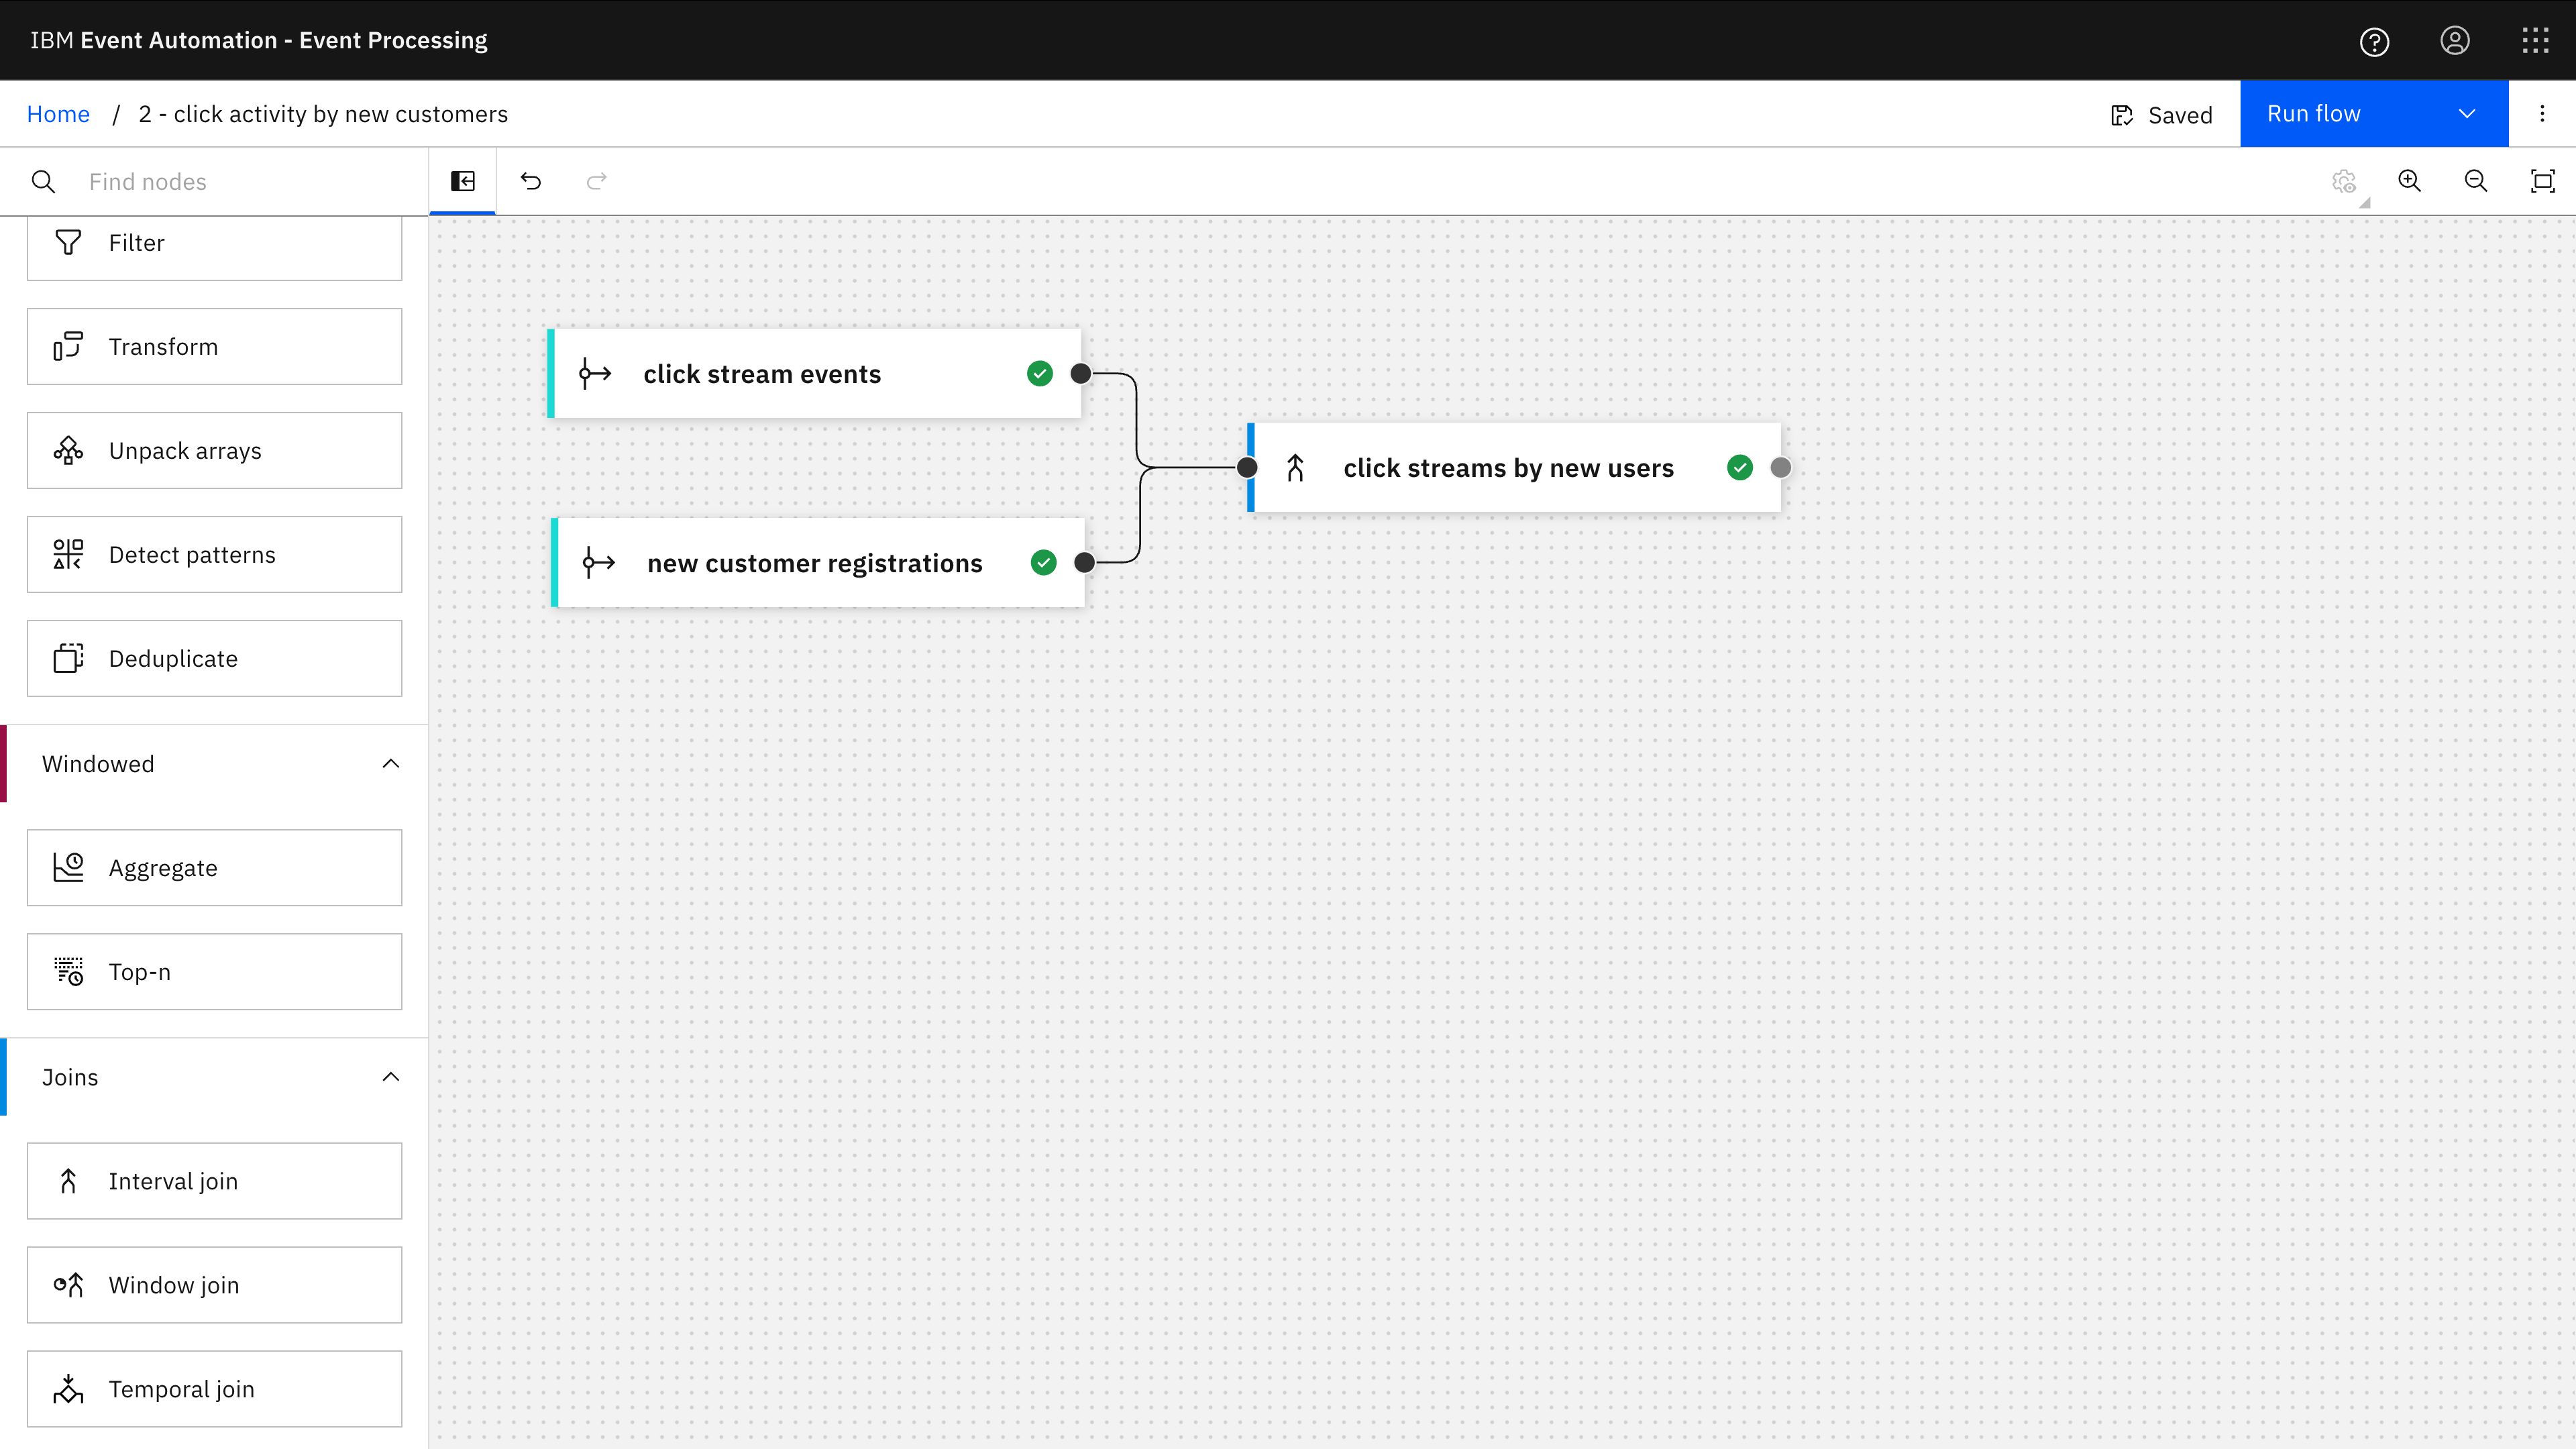
The Event Processing project contains two event source nodes (one for a click tracking topic, the second for a customer registrations topic) and an Interval Join node to correlate events between them.
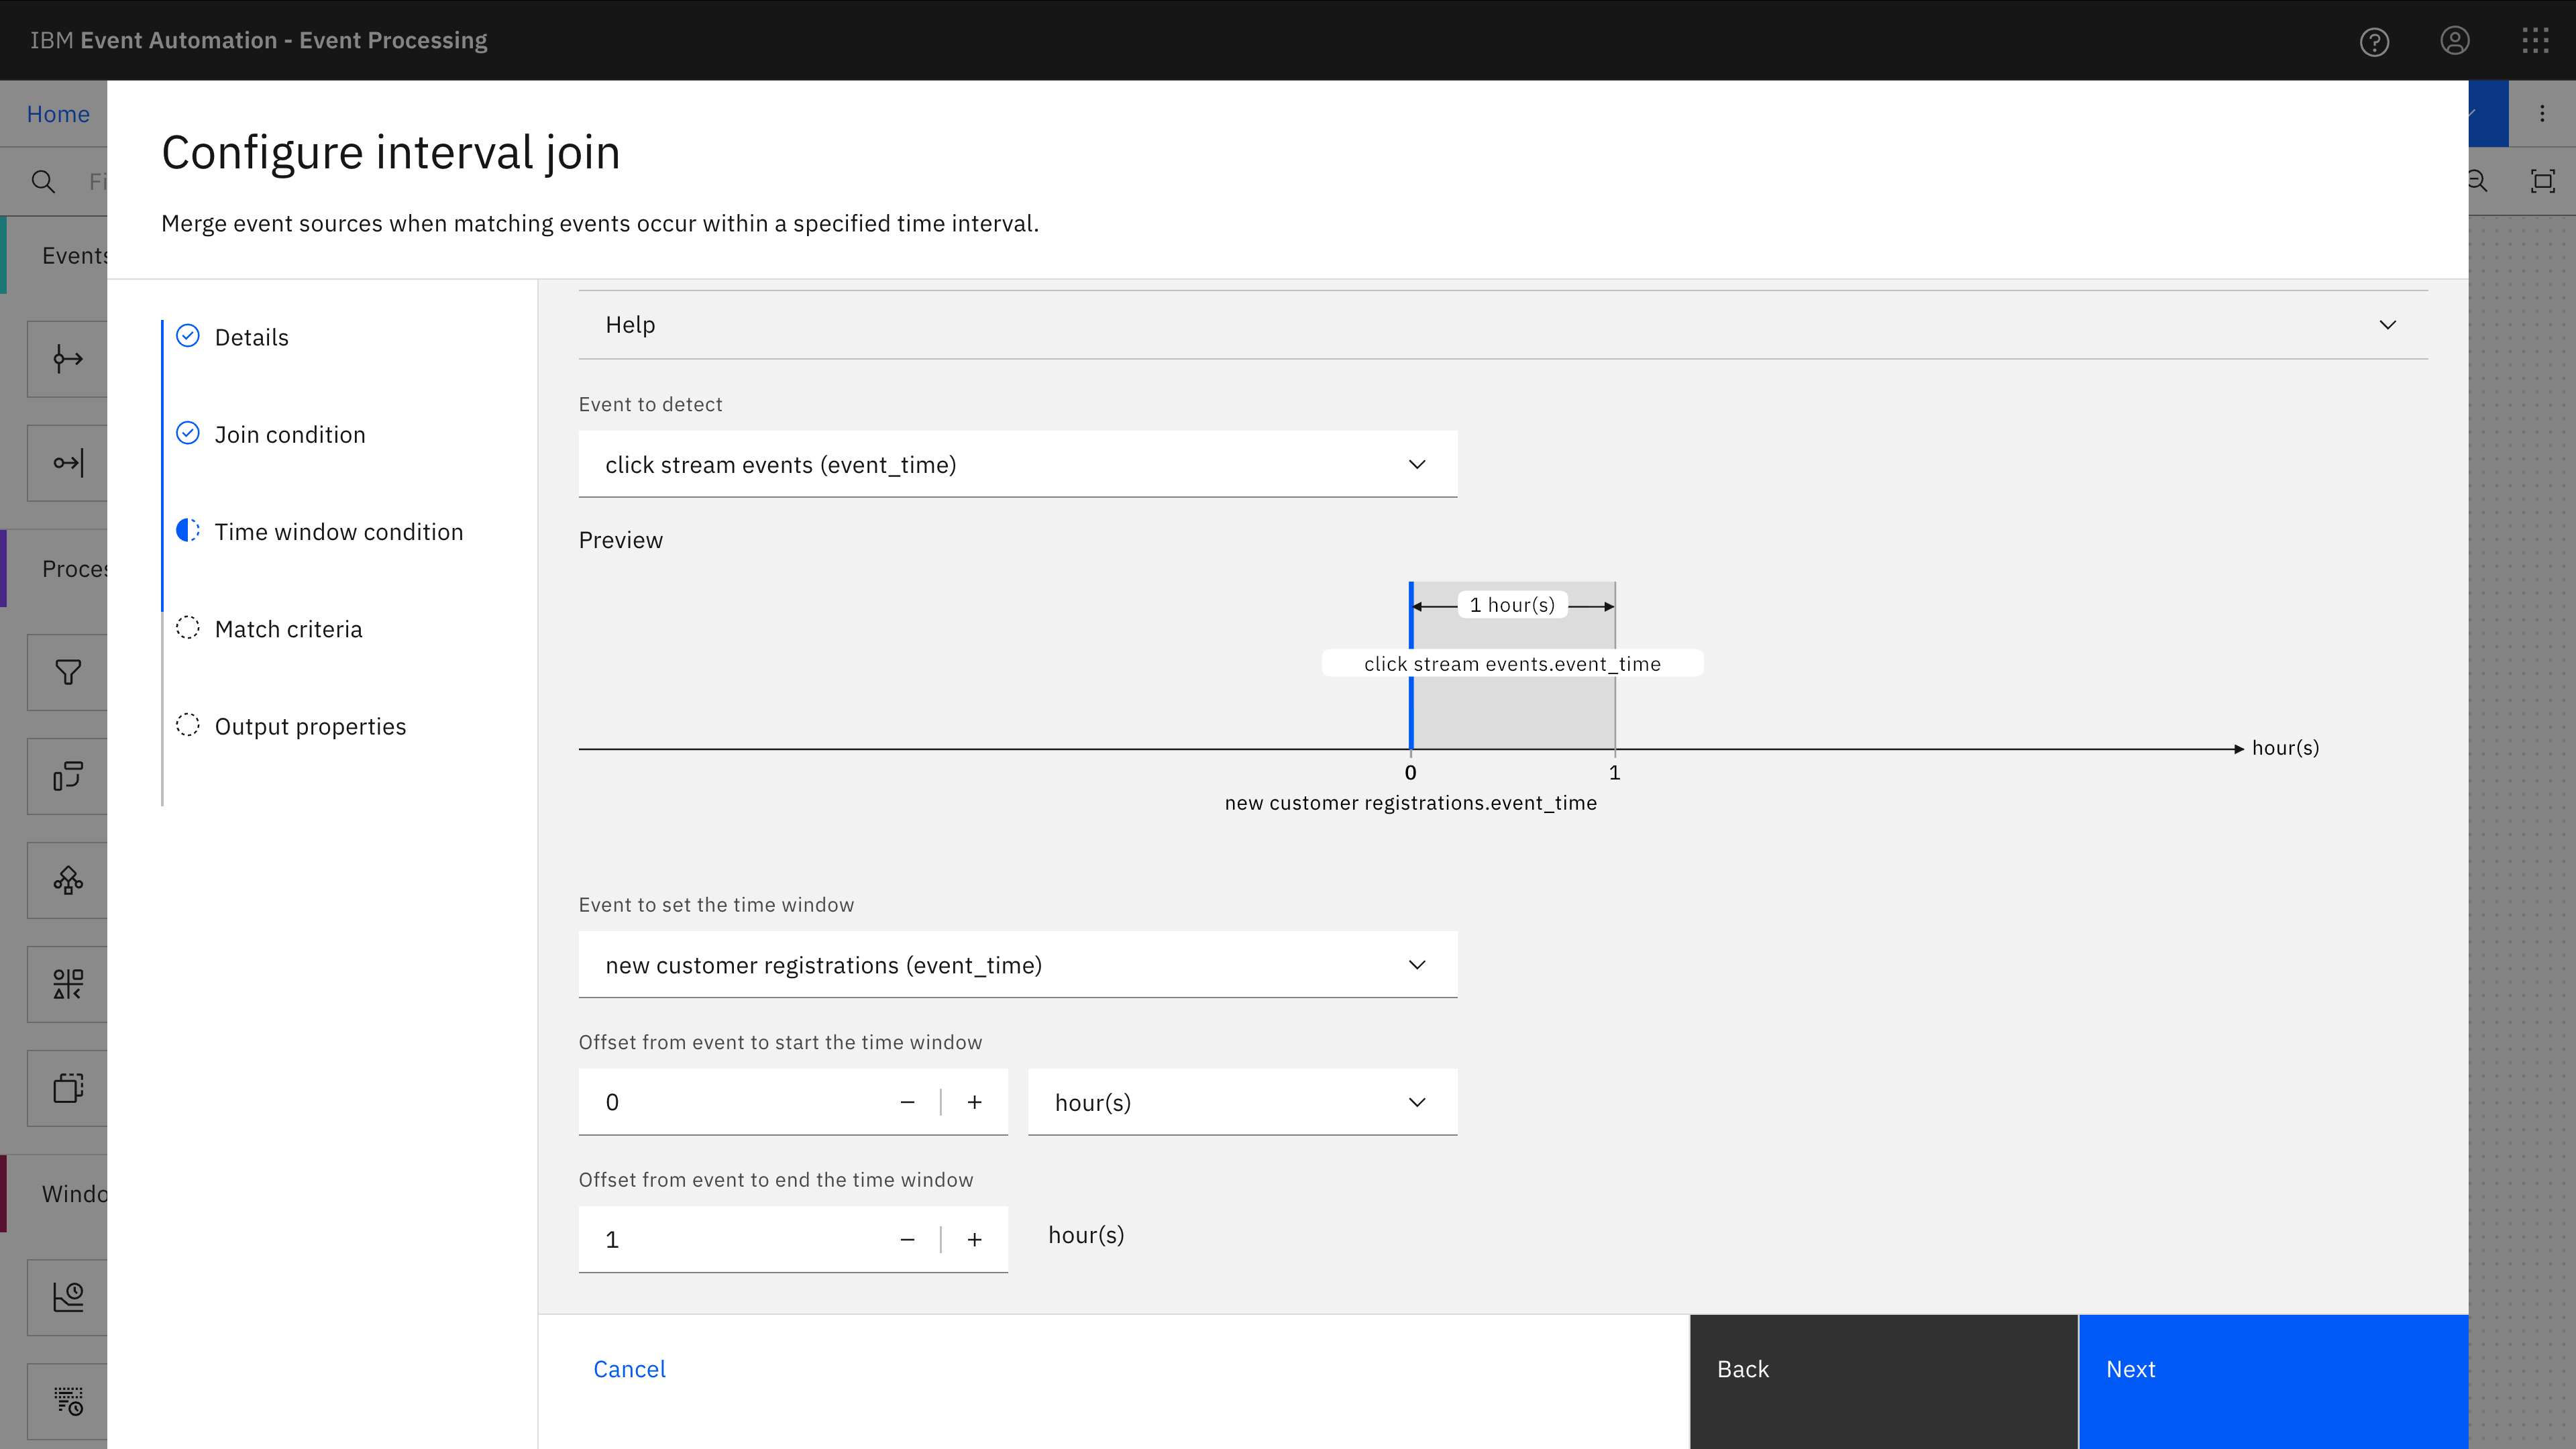
The assistant was helpful here to configure the interval join. I needed to decide on the time window to use (how soon after a new customer registers I’m interested in seeing their click tracking events).
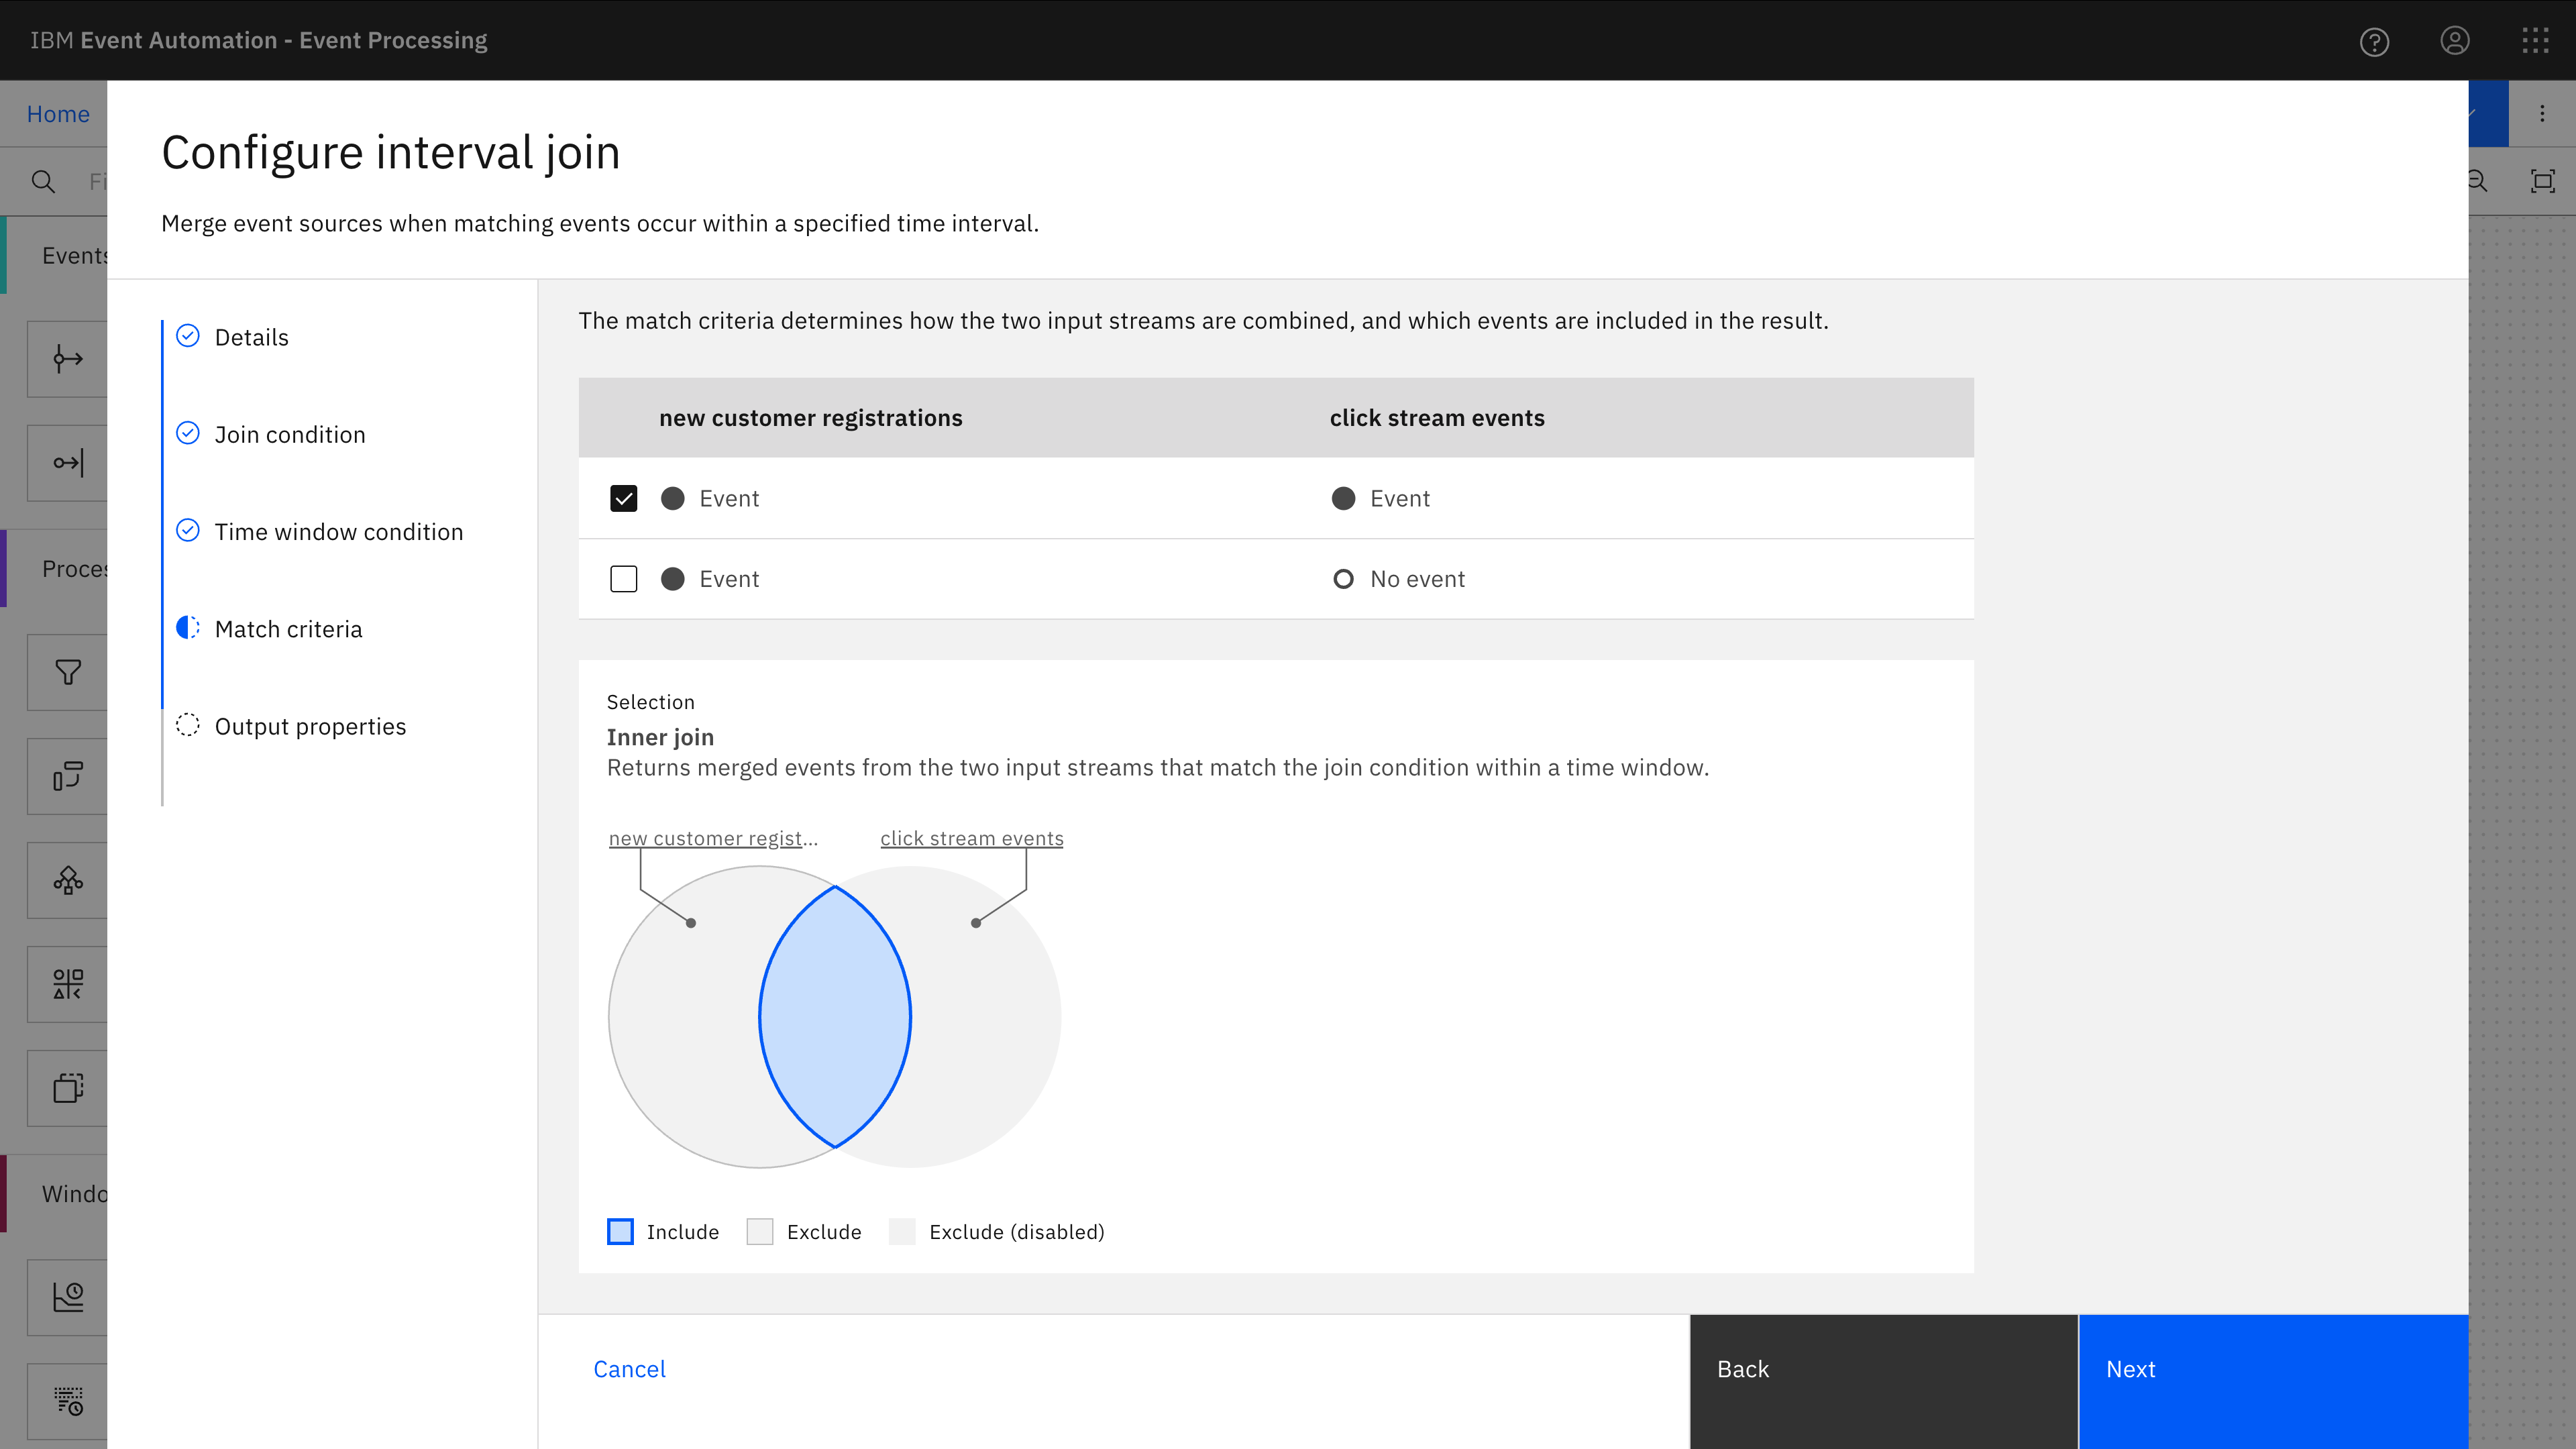
The assistant also helped me choose an appropriate join type. In this case, I wanted an inner join – I want to see only click tracking events where a customer registration event was observed within the time window.
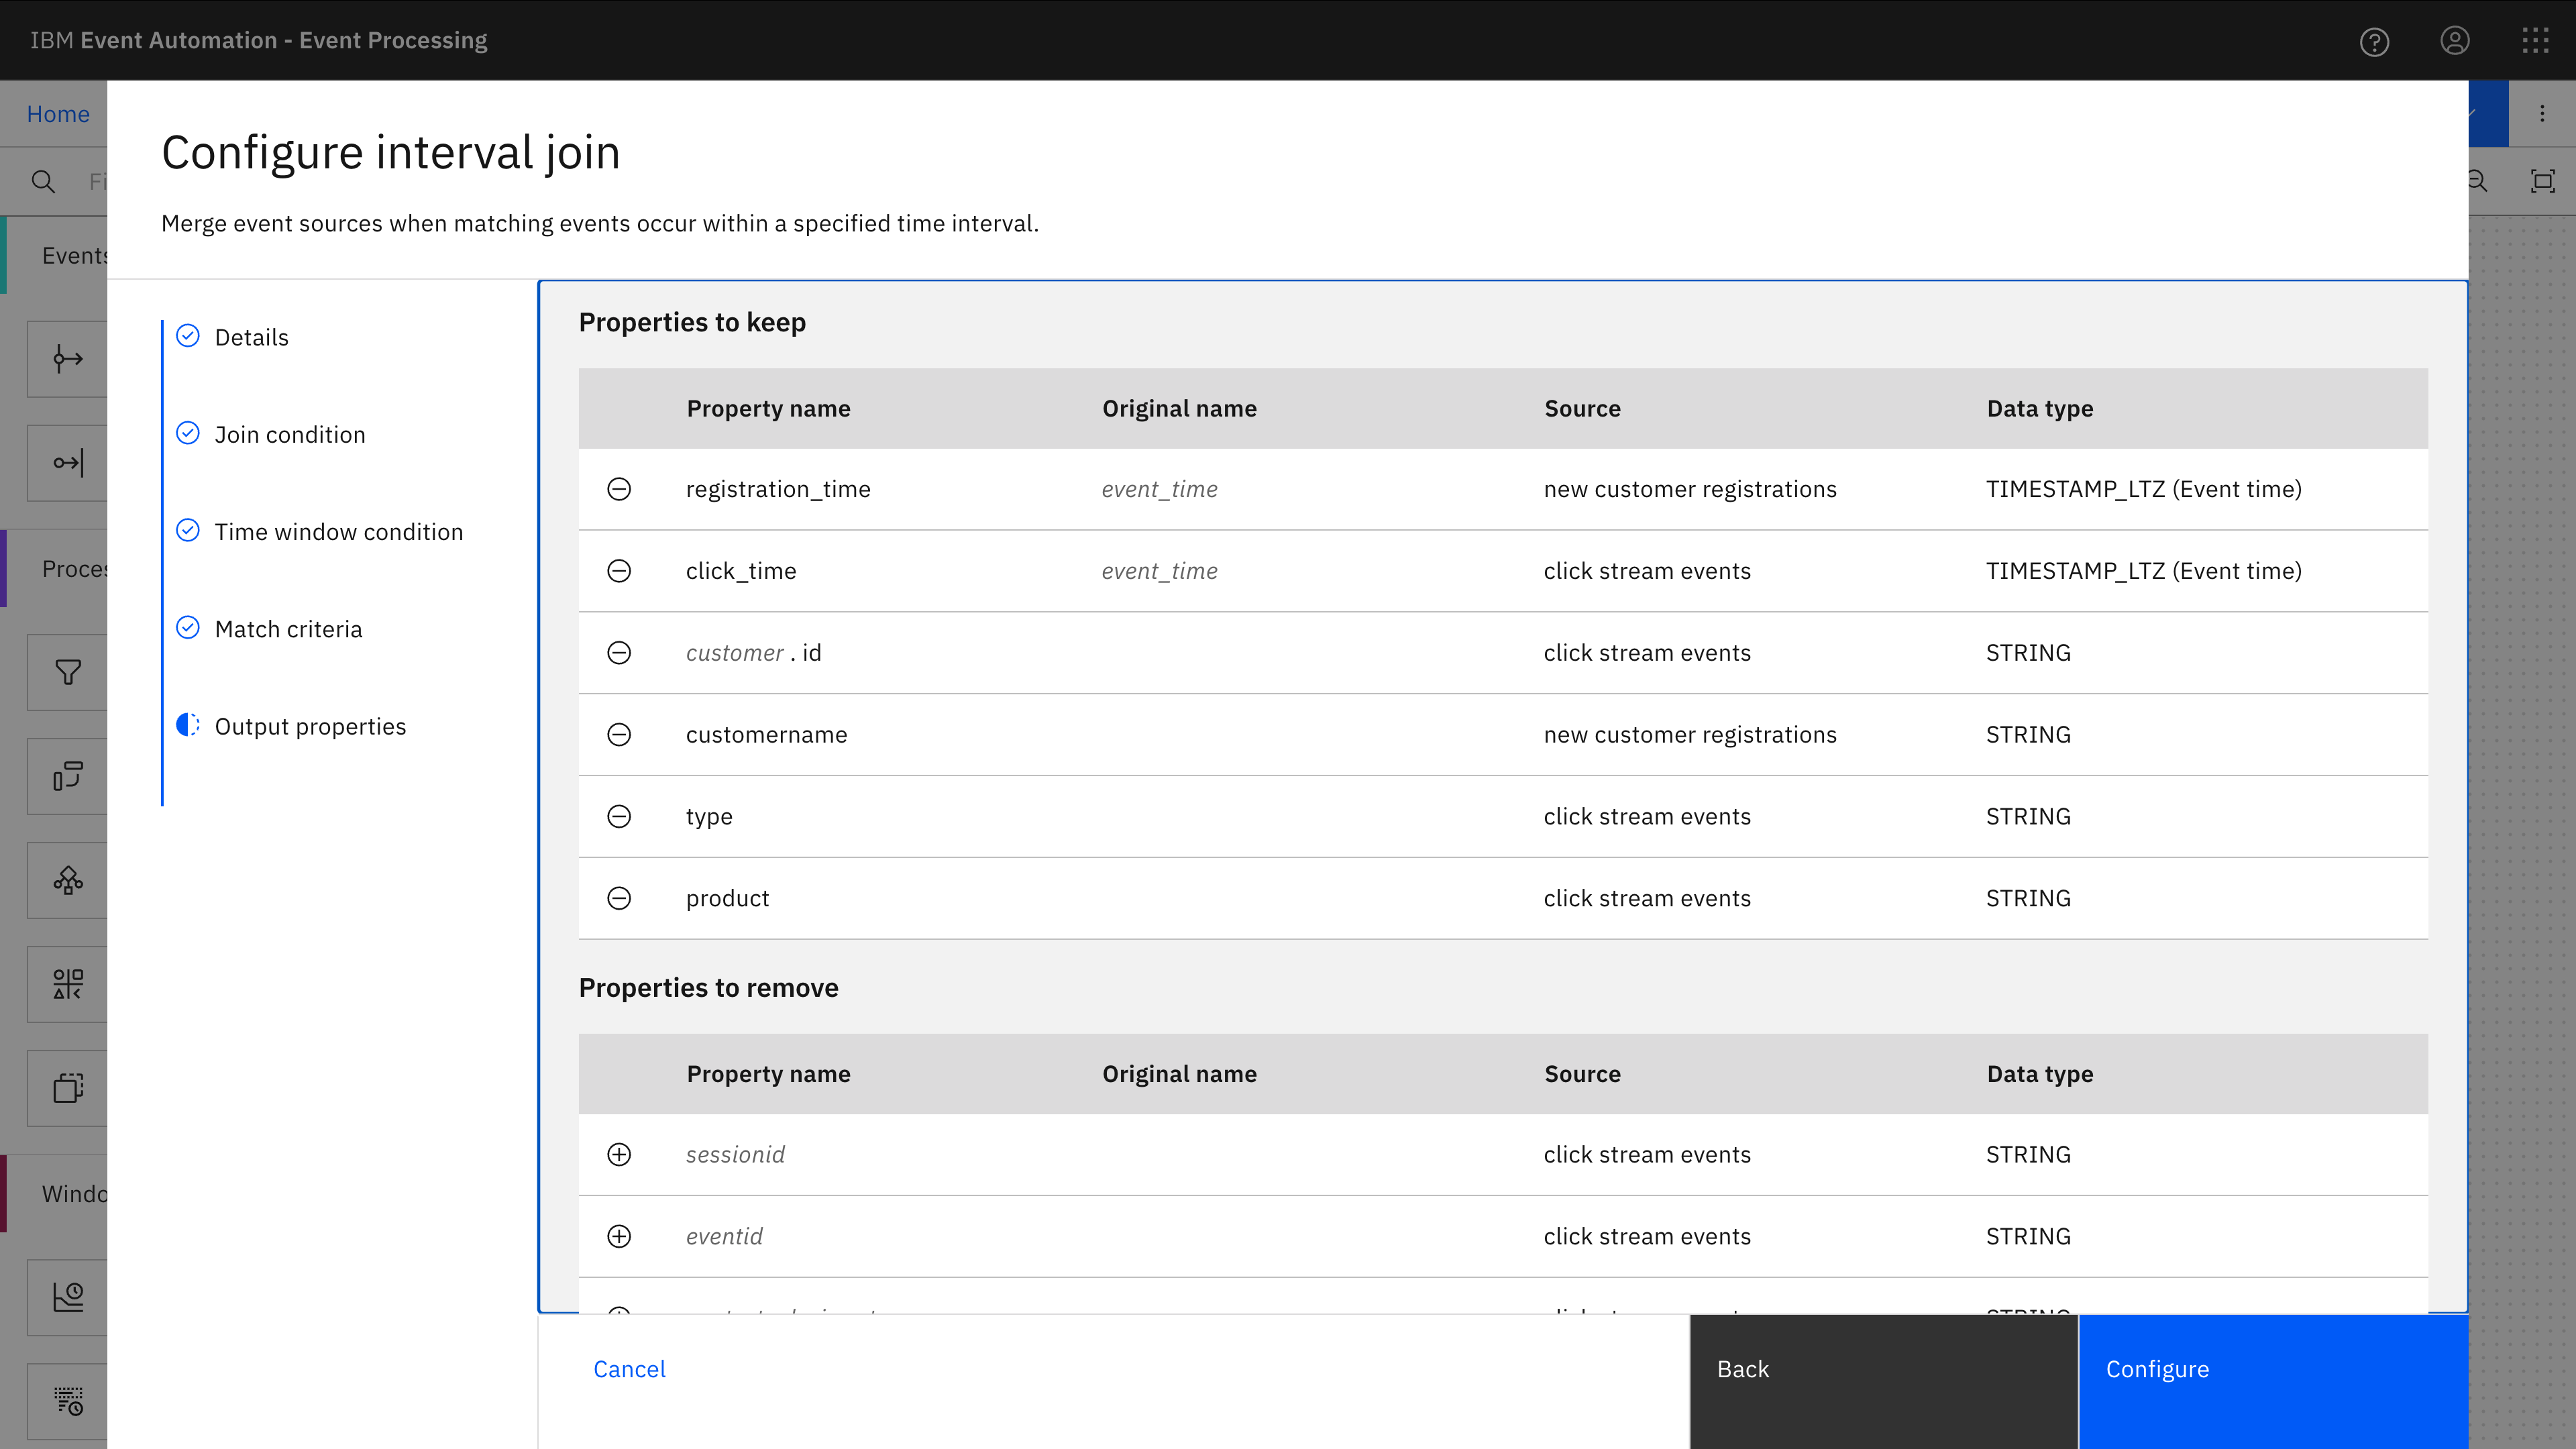
Finally, the assistant helped me define the format for the output I wanted – choosing (and renaming) the properties from the two different input streams to keep.
As before, I’ve added comments to the generated SQL to make it more readable.
The interesting bits are lines 122-134 which are an example of how to use an interval join to correlate between two streams of events.
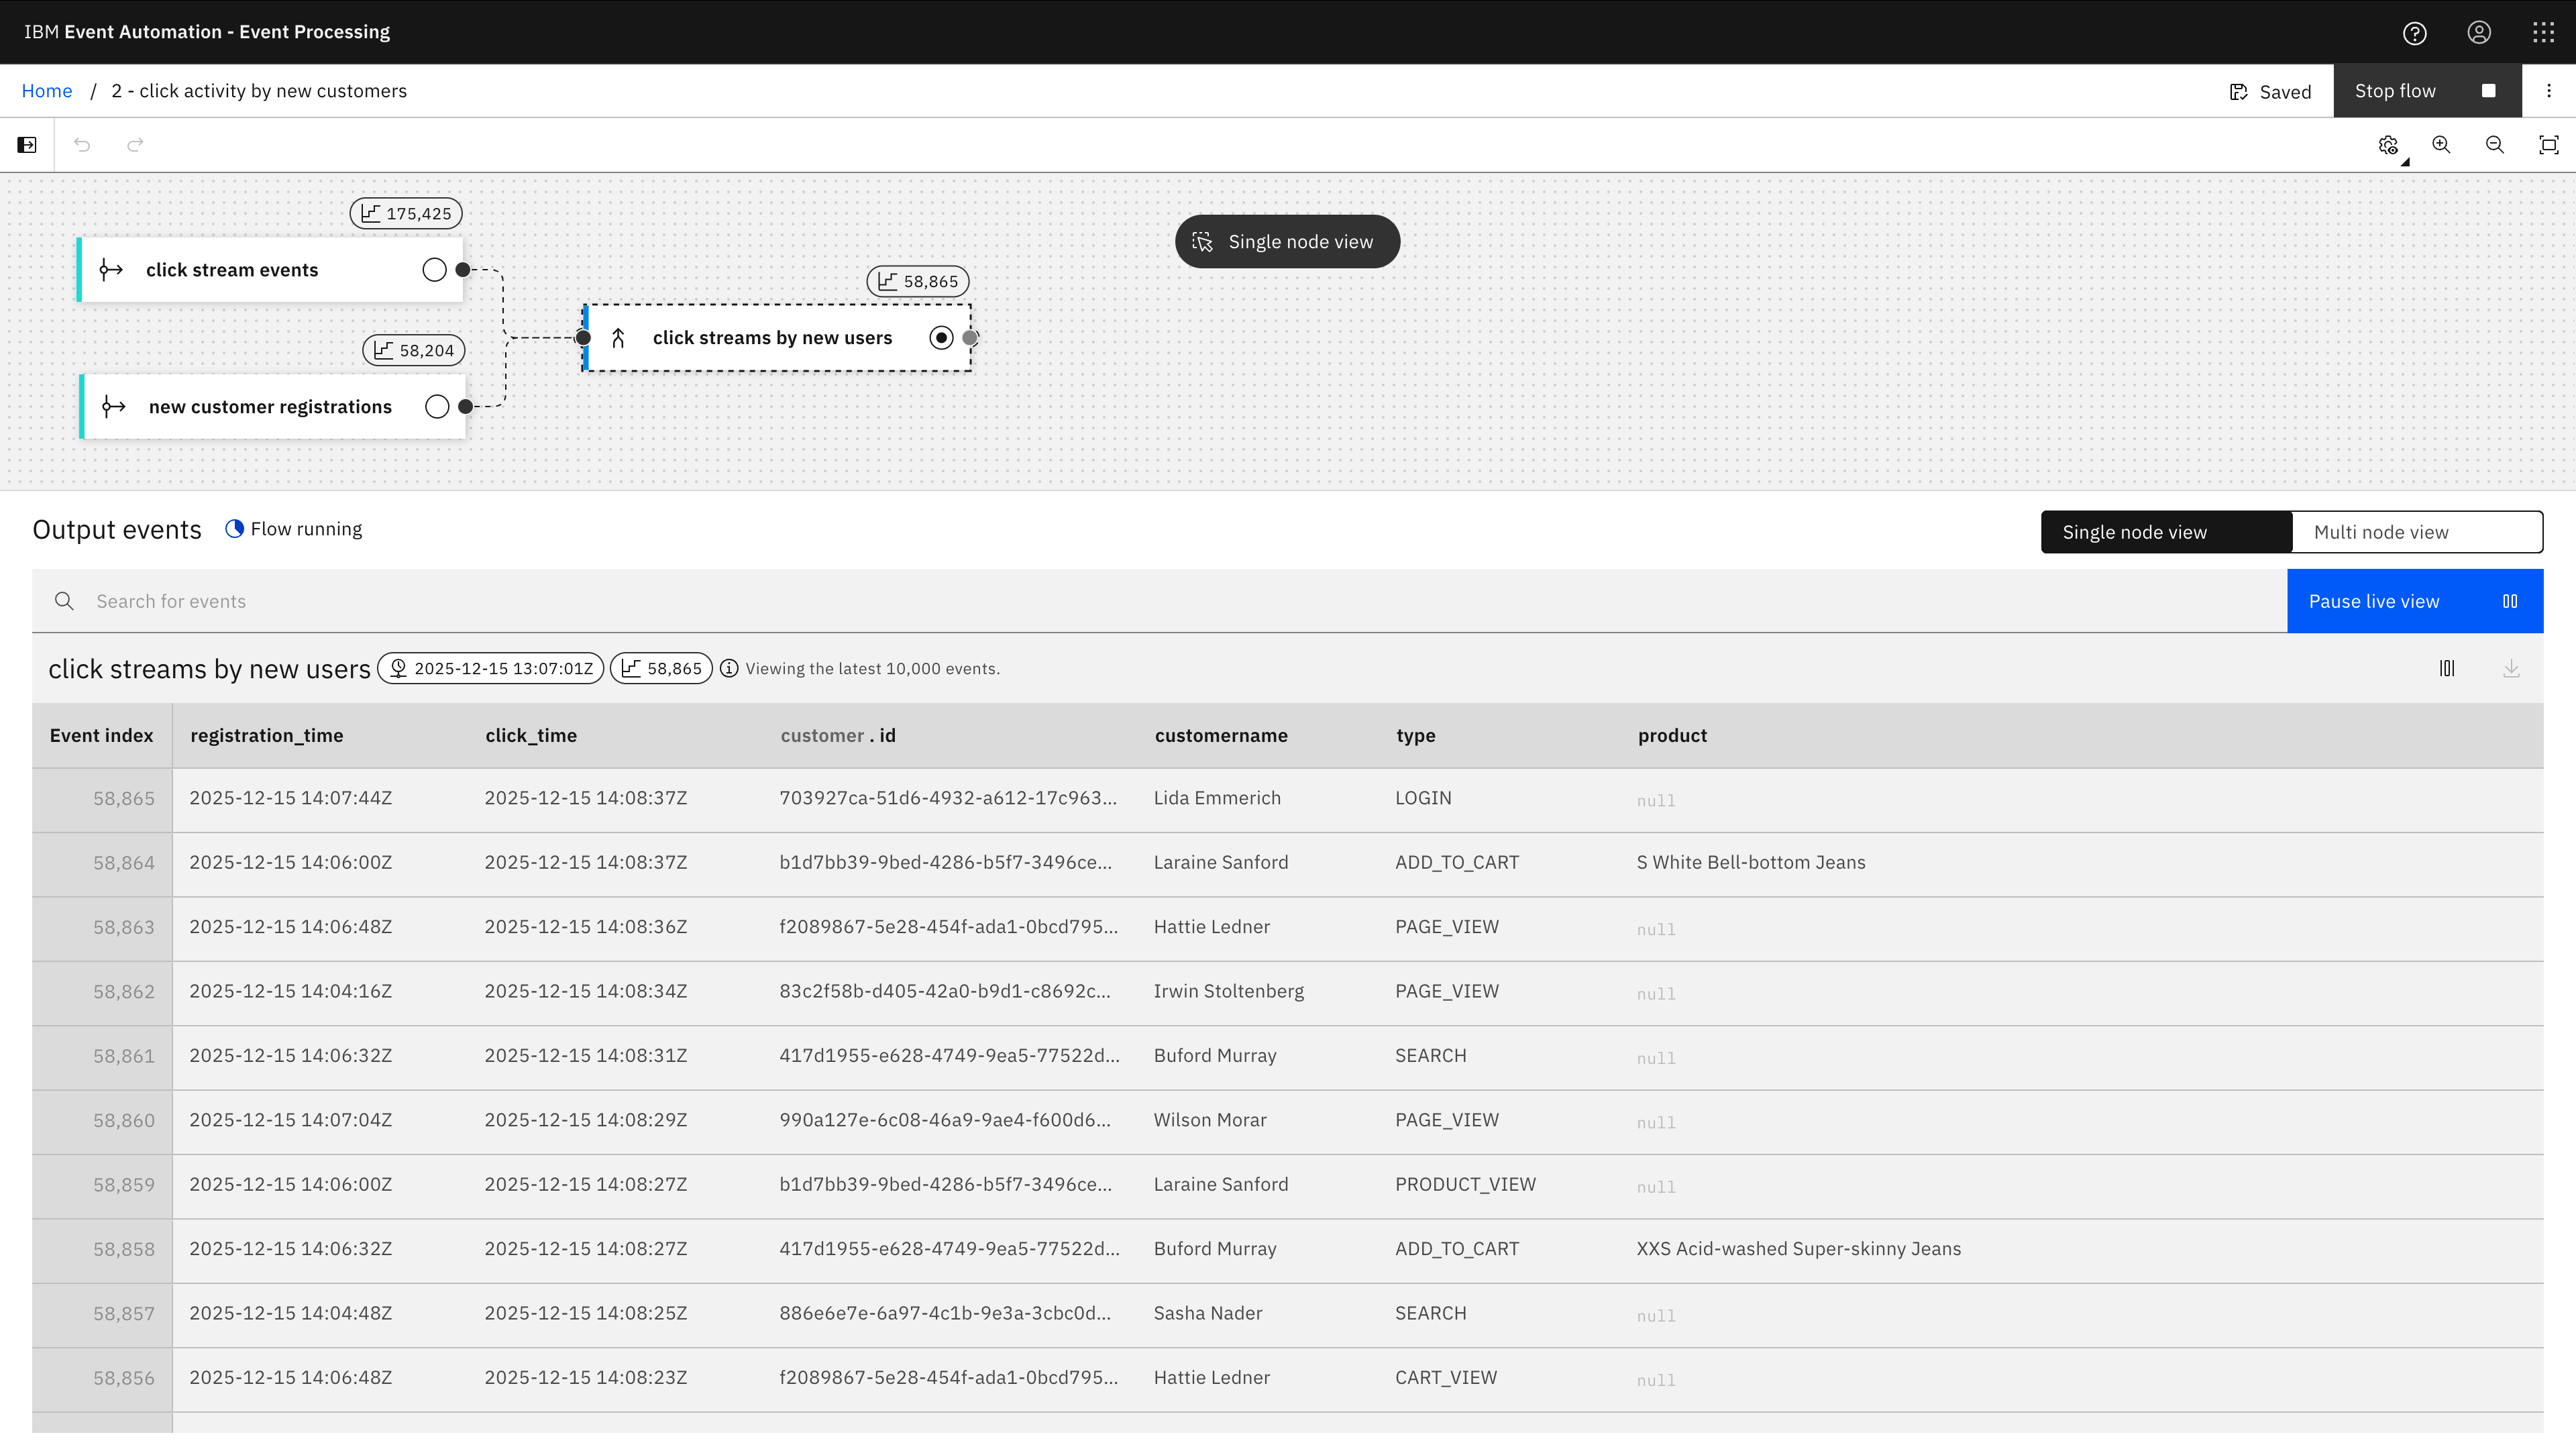
The screenshot above from running the flow in Event Processing shows just click tracking events for customers within the first hour after they create their new account.
3 Browser and device usage
Demonstrating how to aggregate events within a tumble window to determine the types of device (desktop, tablet, mobile) used each hour.
Demonstrating how to use a Top-N query to identify the most-used web browser in each hour.
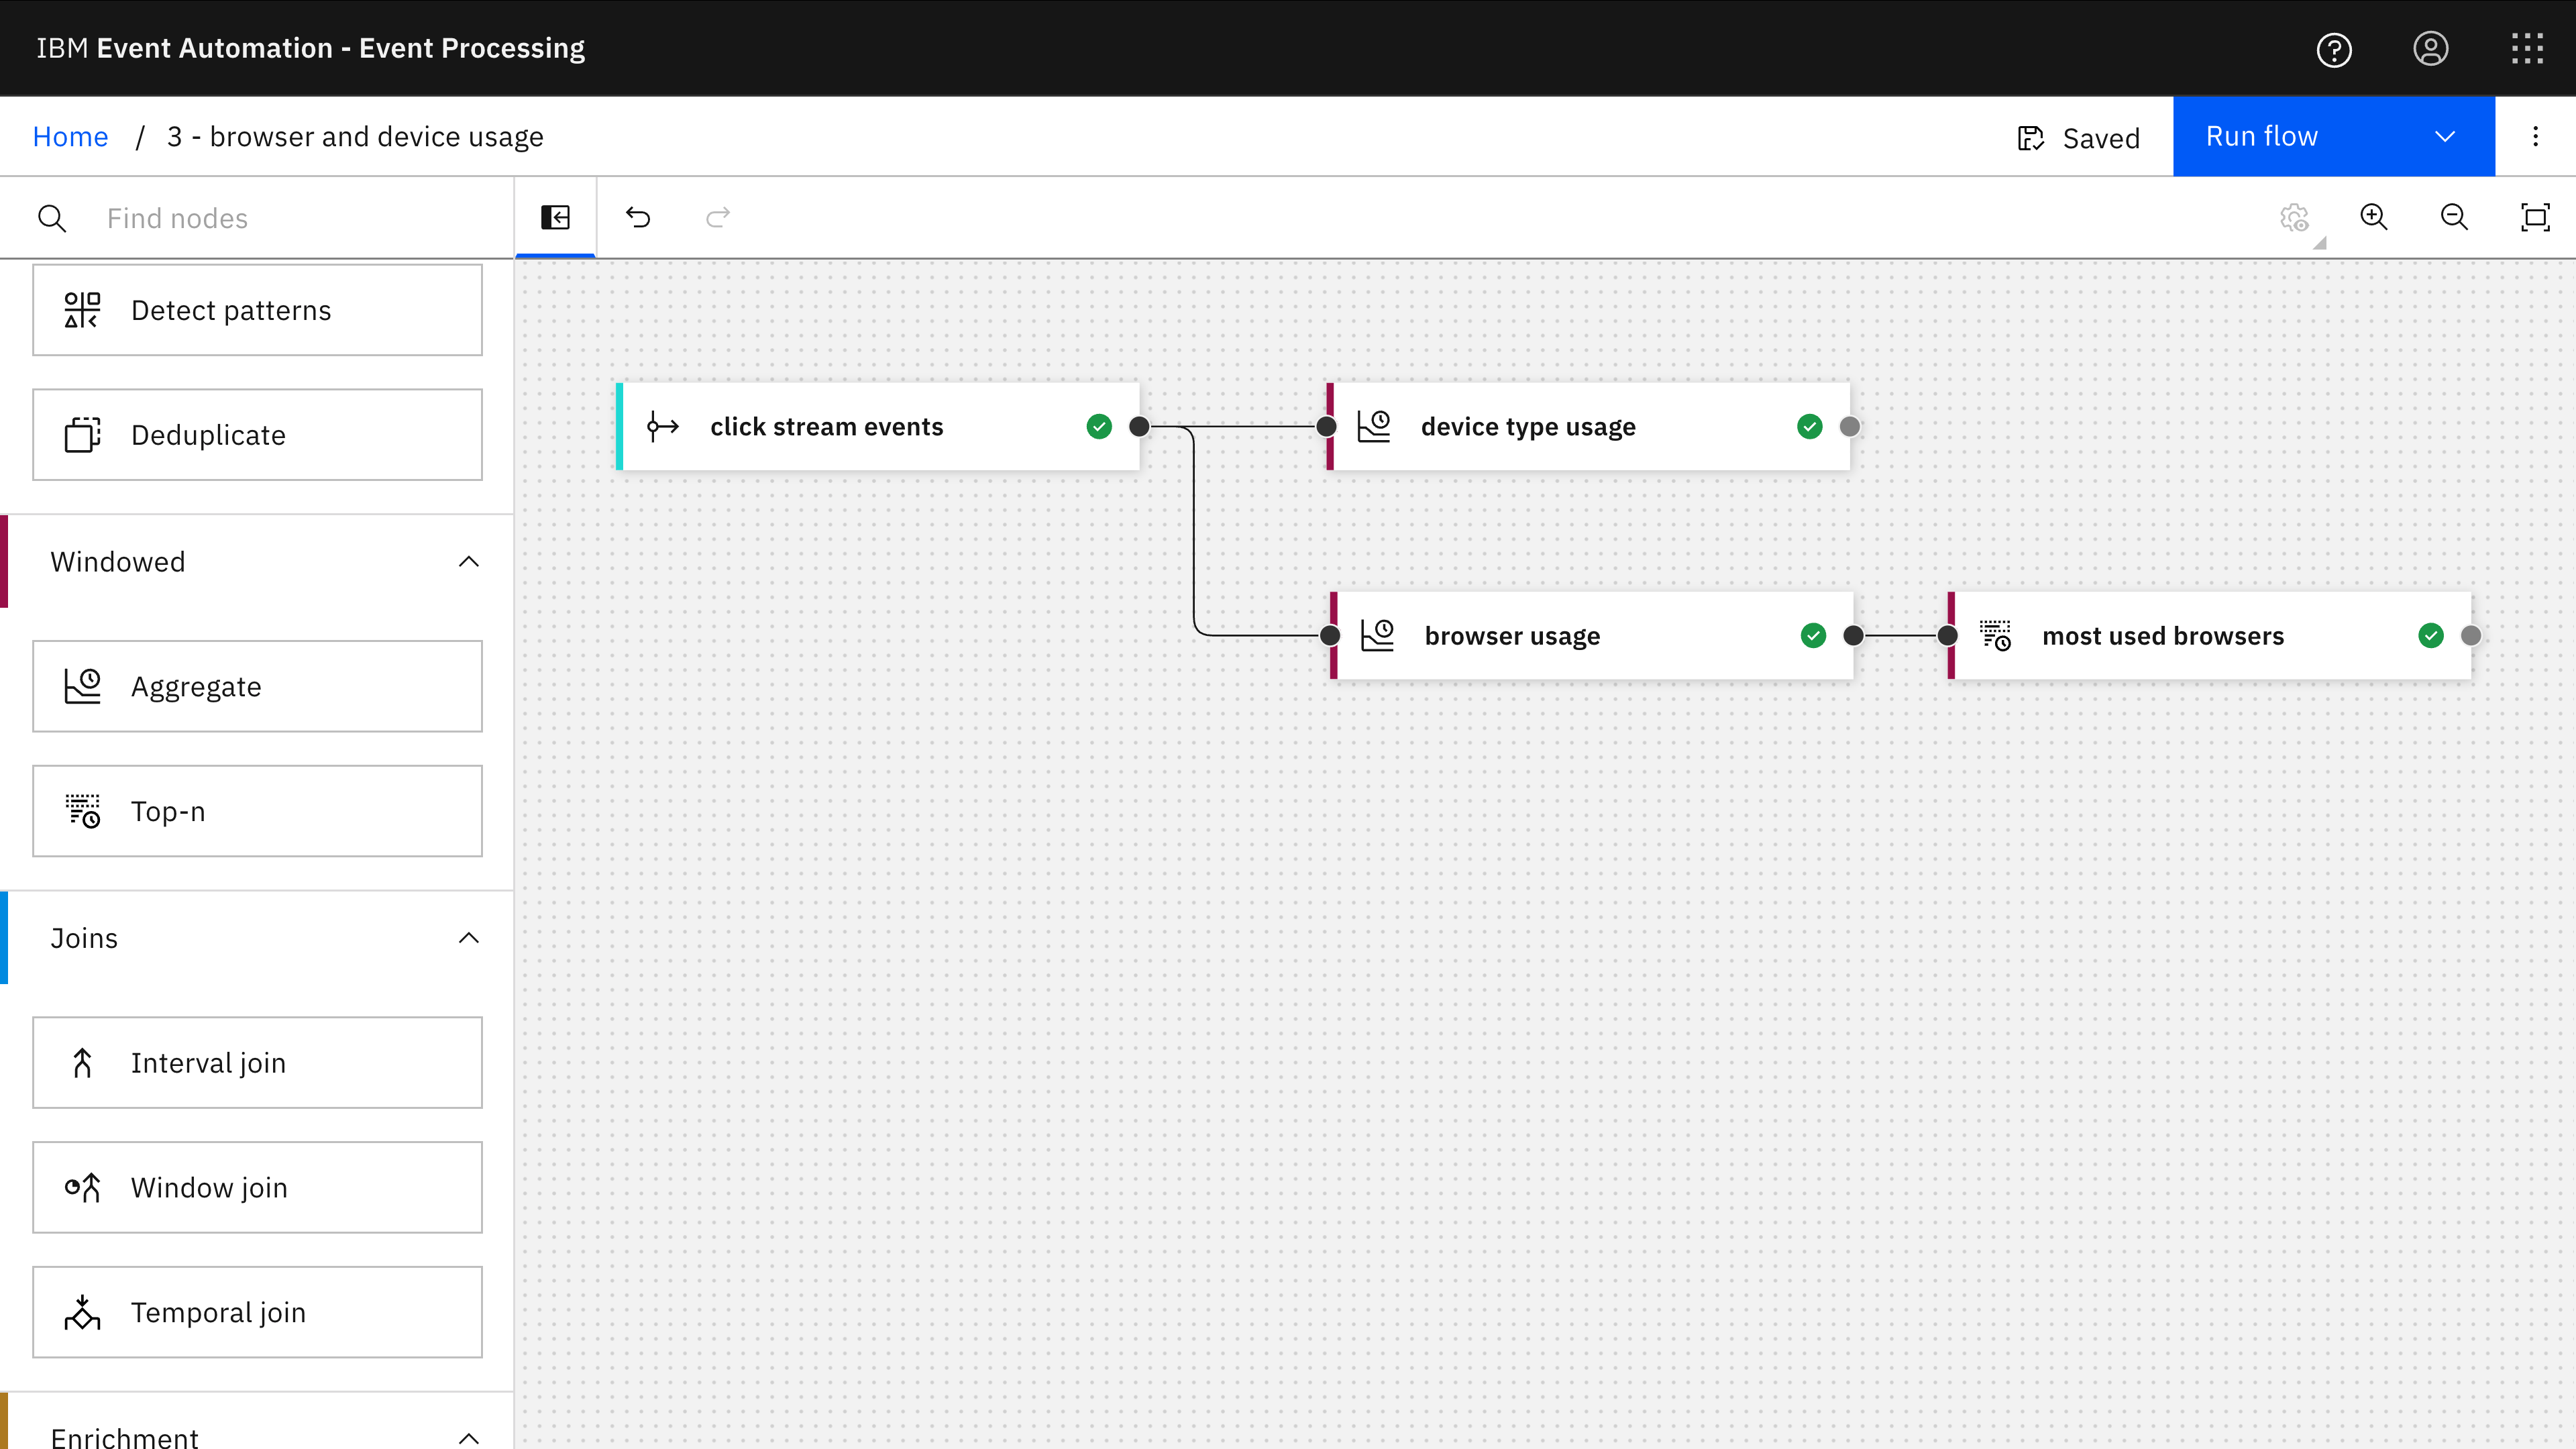
The Event Processing project for this example contains two different tumble window aggregate nodes – one to count device types per hour, the second to count browser names per hour. The second aggregate also has a Top-N node to identify the most used browser name in each hour.
All click tracking events contain a sessionid. This can be used to correlate the multiple different events from a single user as being part of the same overall user session.
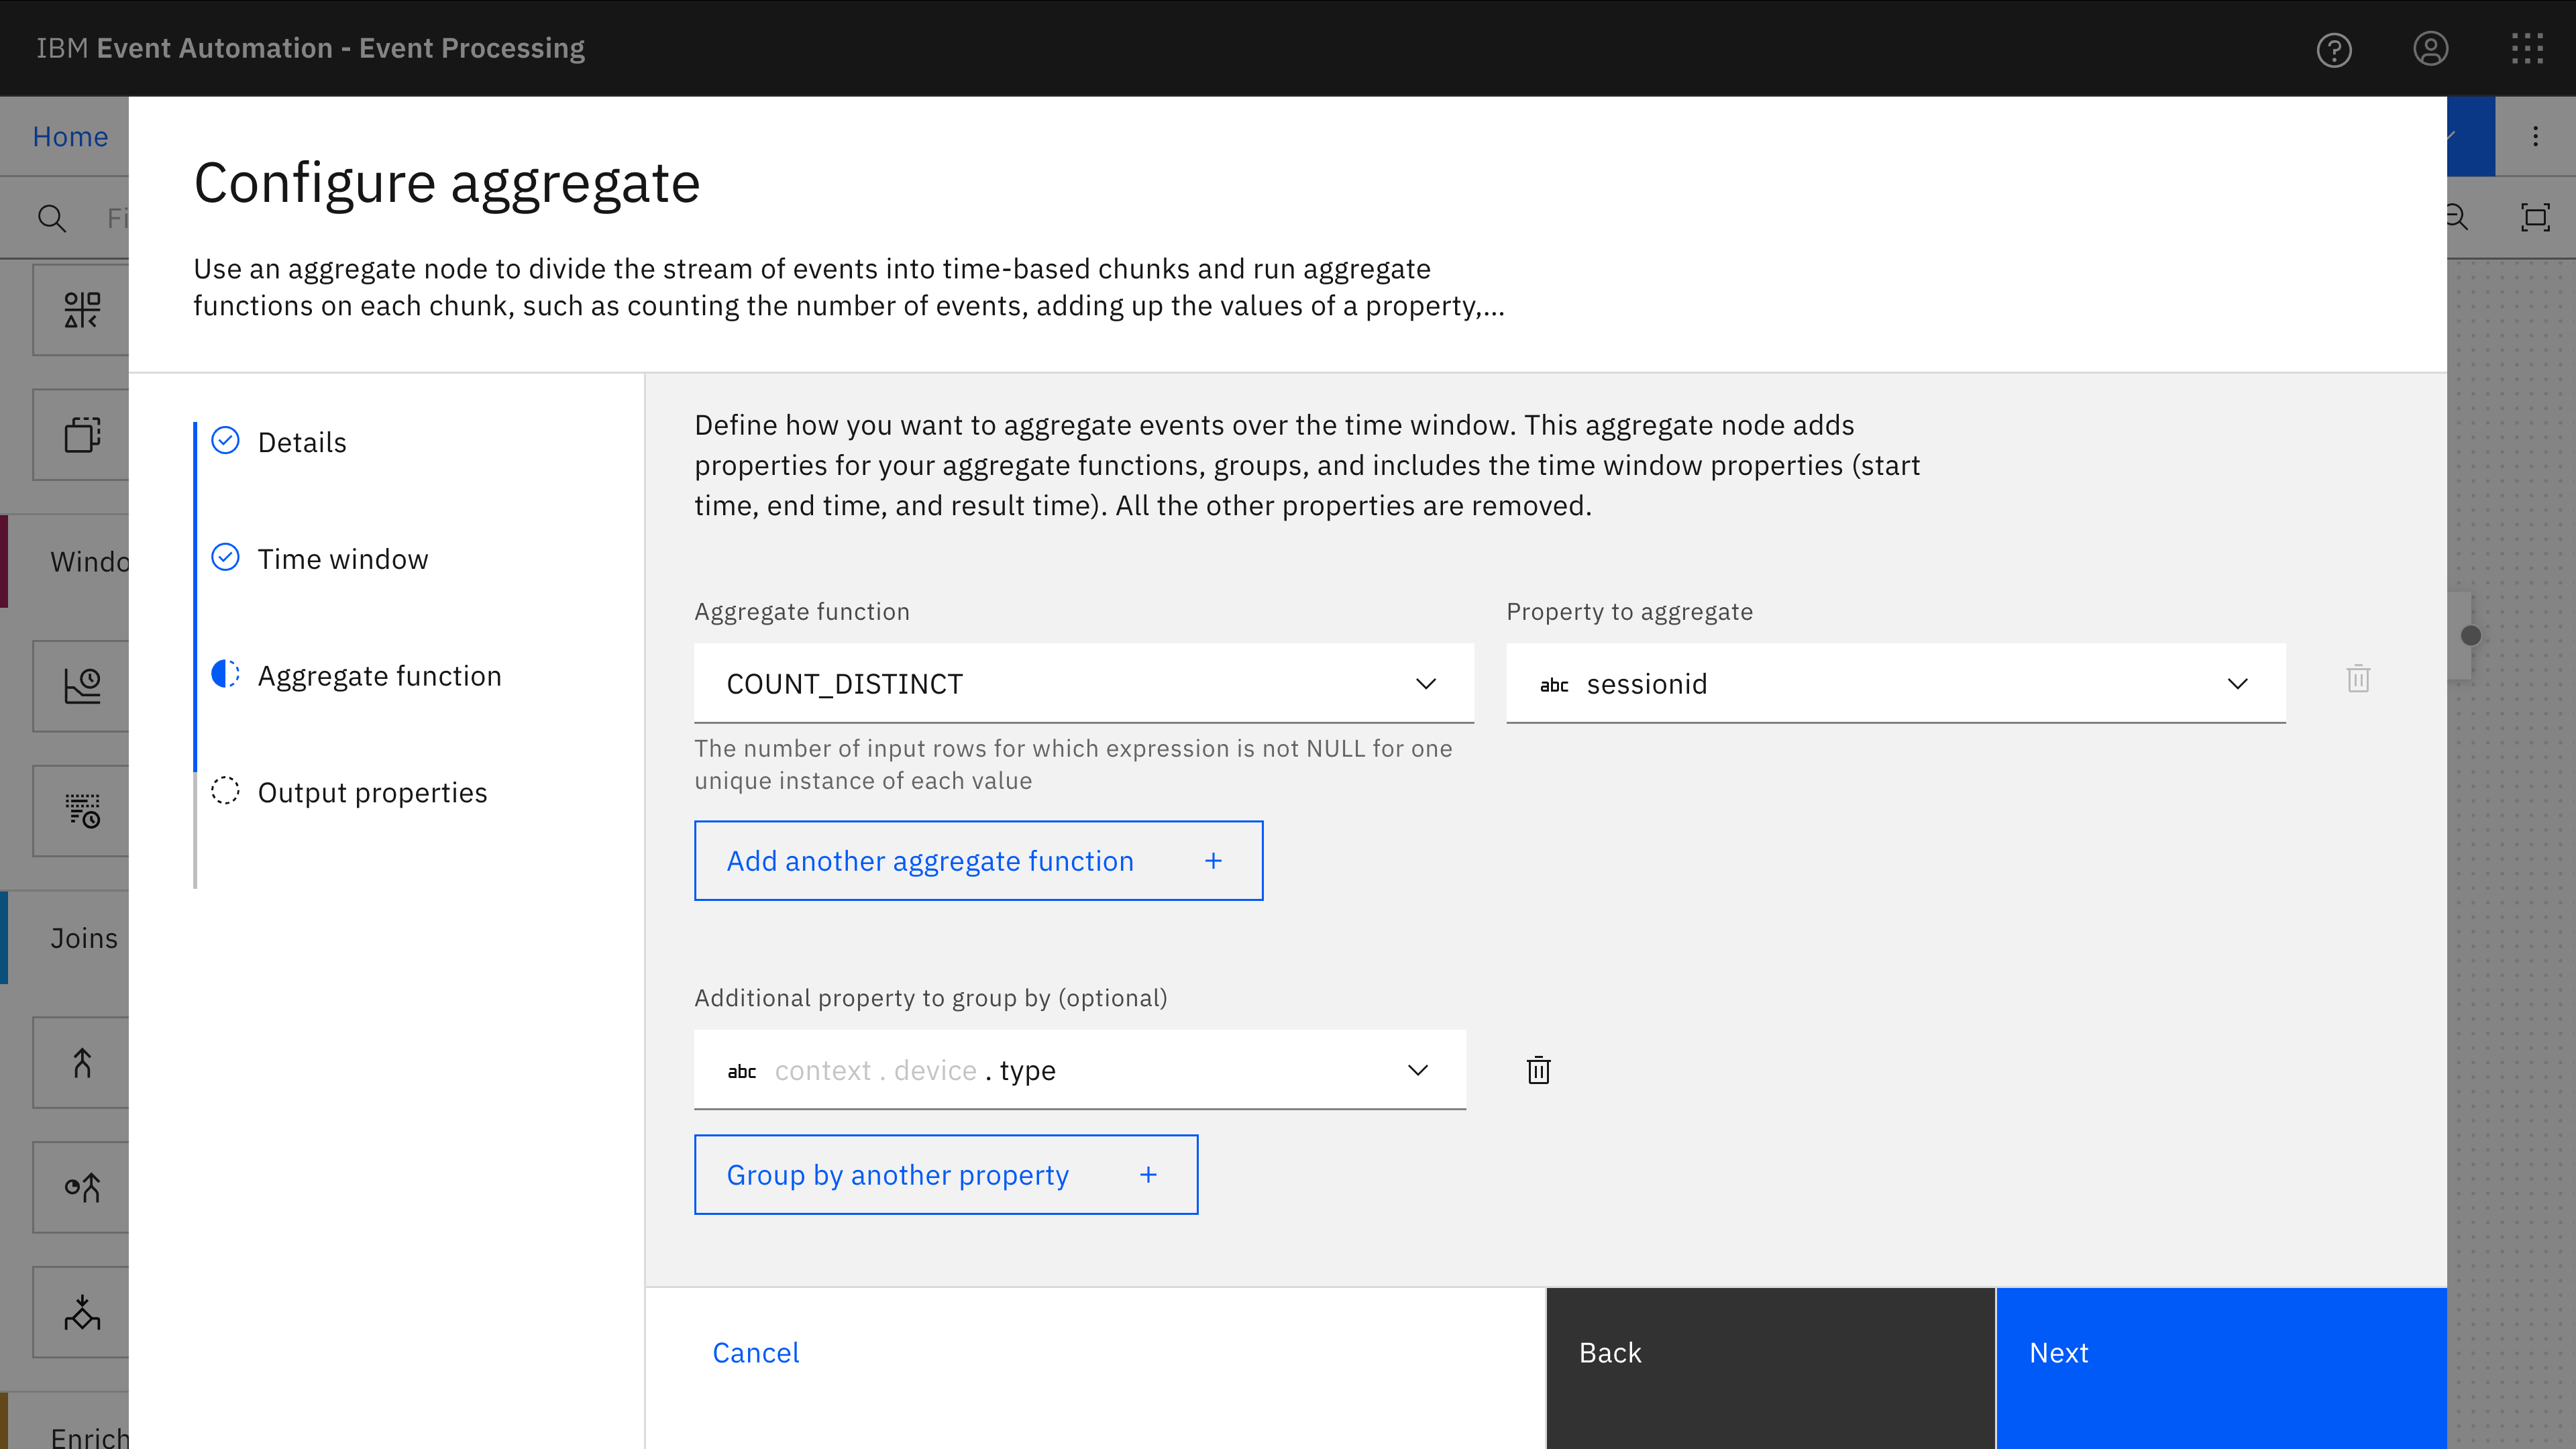
The first aggregate is a tumble window to count the number of different session ids that occur in each hour, grouped by the type of device (i.e. desktop, mobile, tablet).
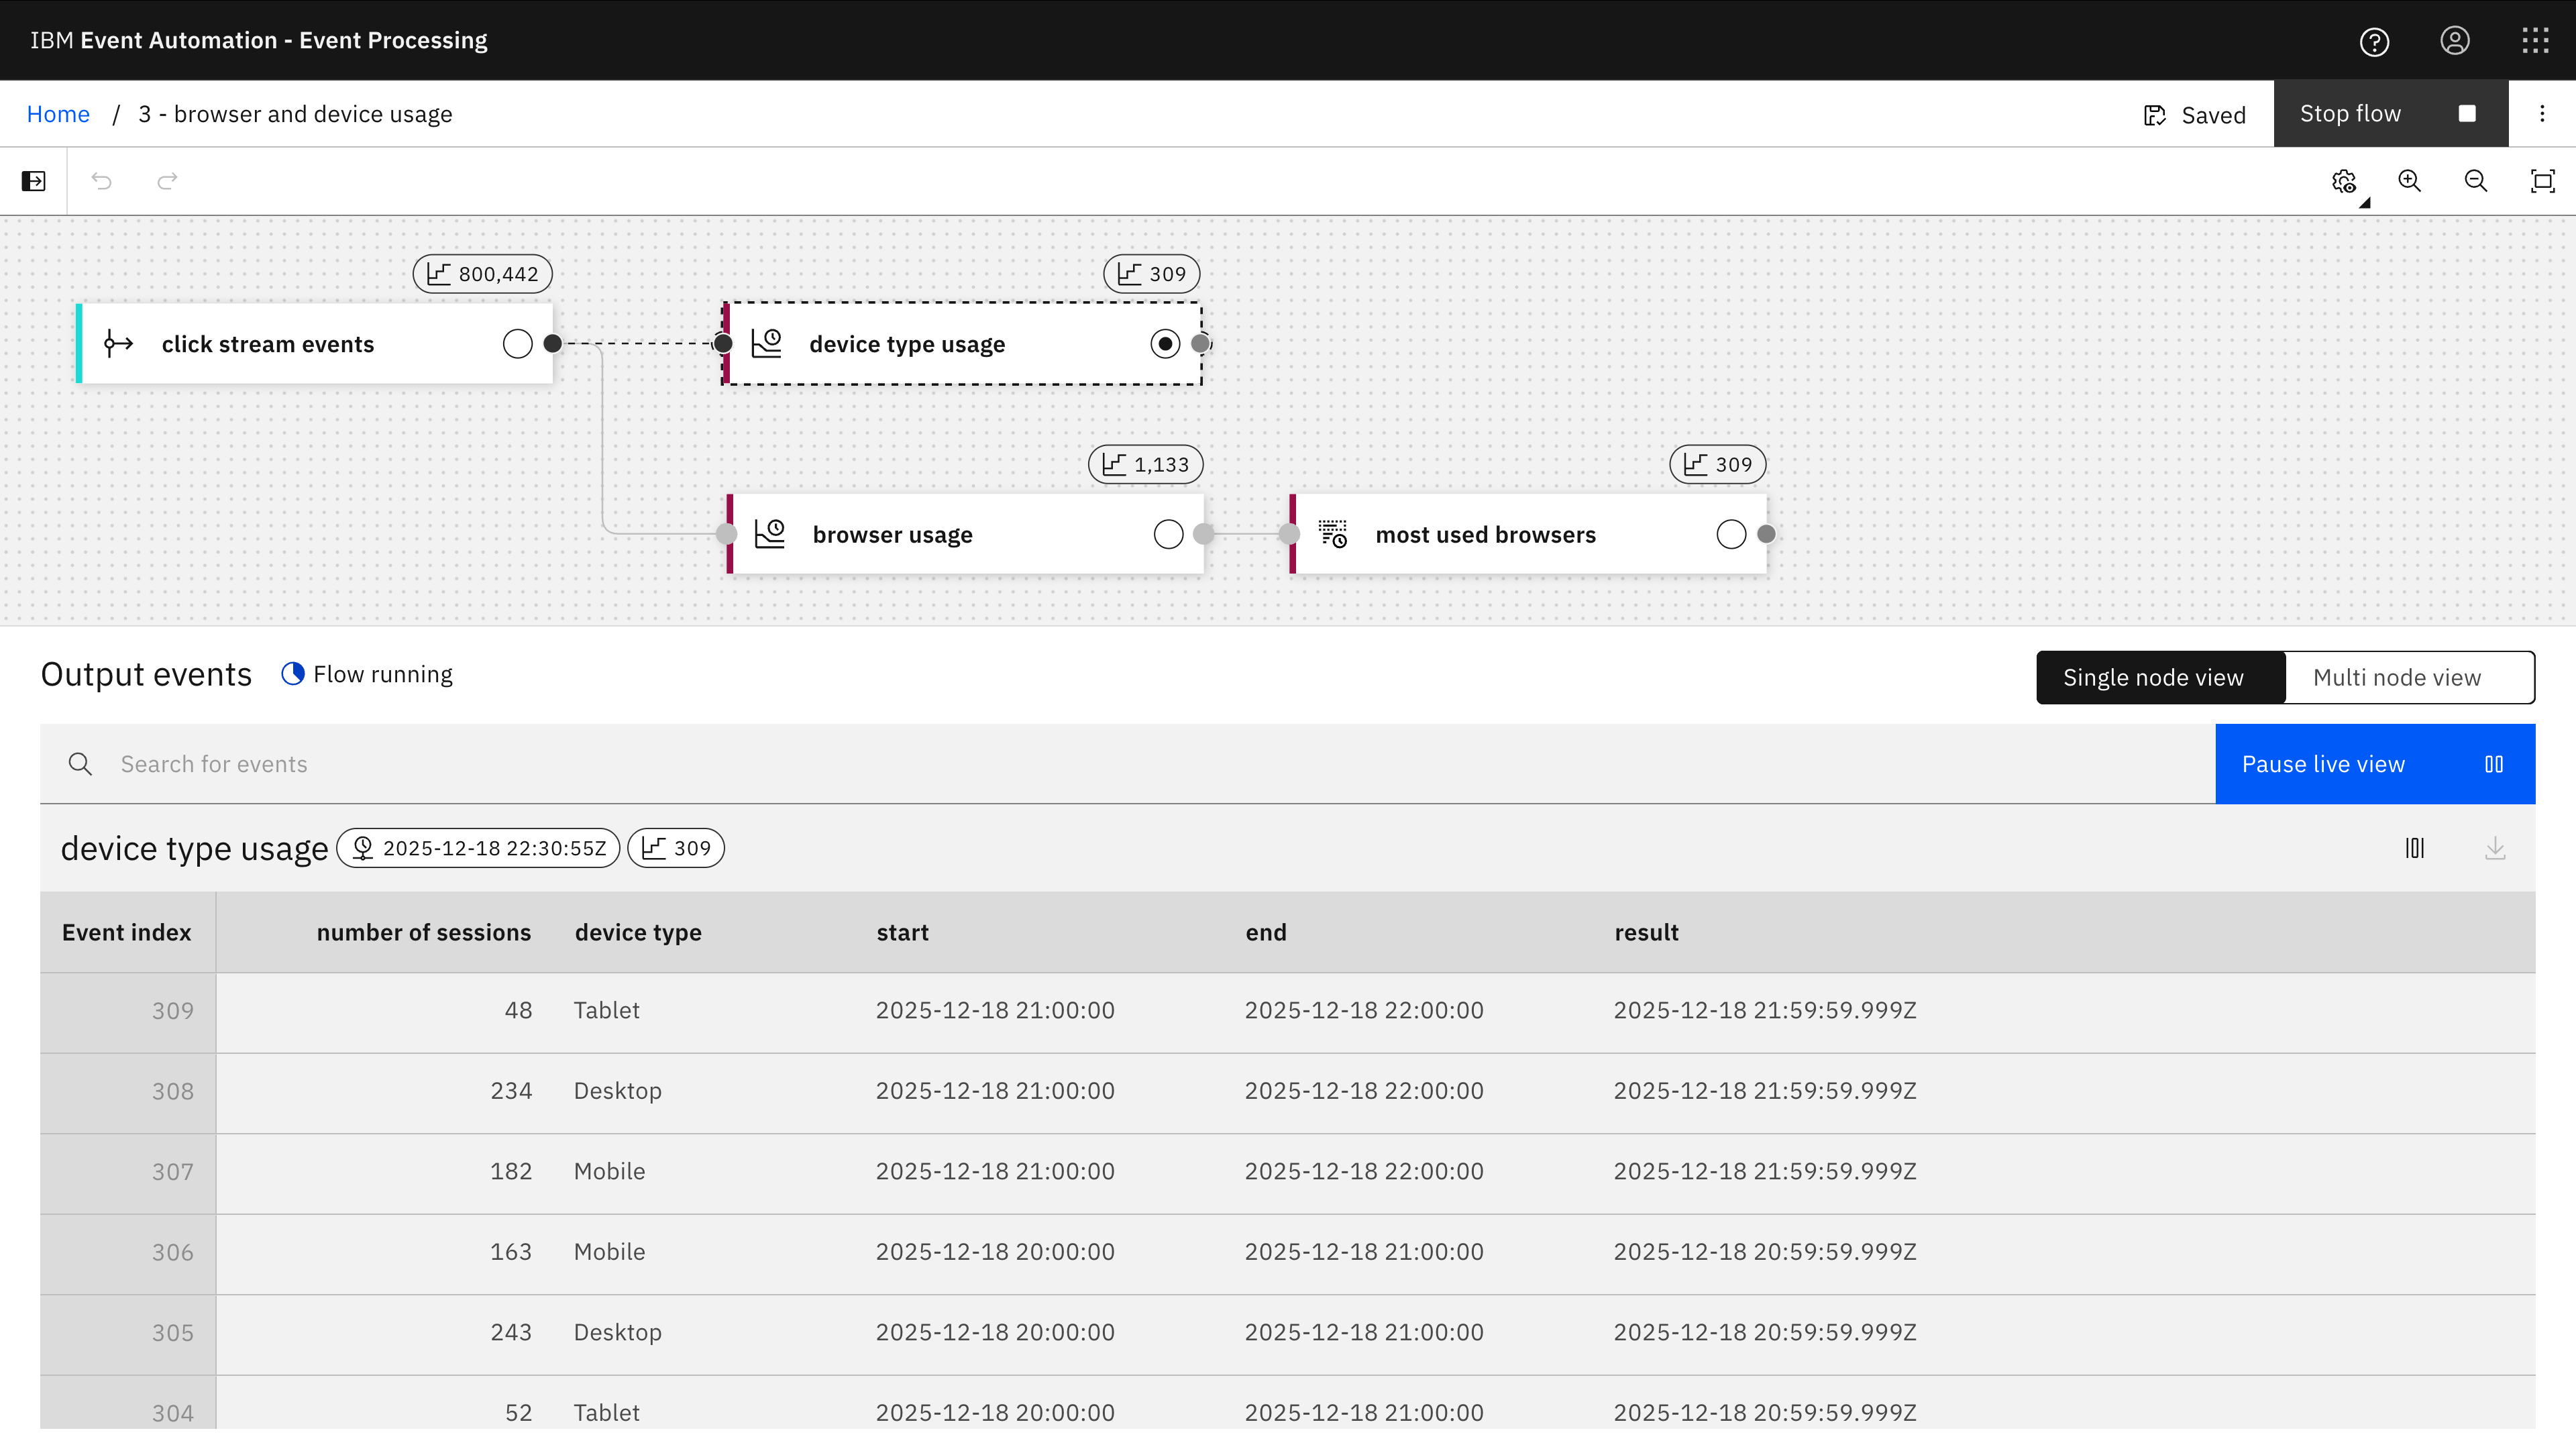
When the flow is running, it will output three events at the end of each hour – one for each device type (desktop, mobile, tablet) with a count of how many unique sessions have been observed with that device type during the hour.
The first aggregate (number of sessions for each device type) is in lines 71-92. I’ve added some comments to explain what it is doing.
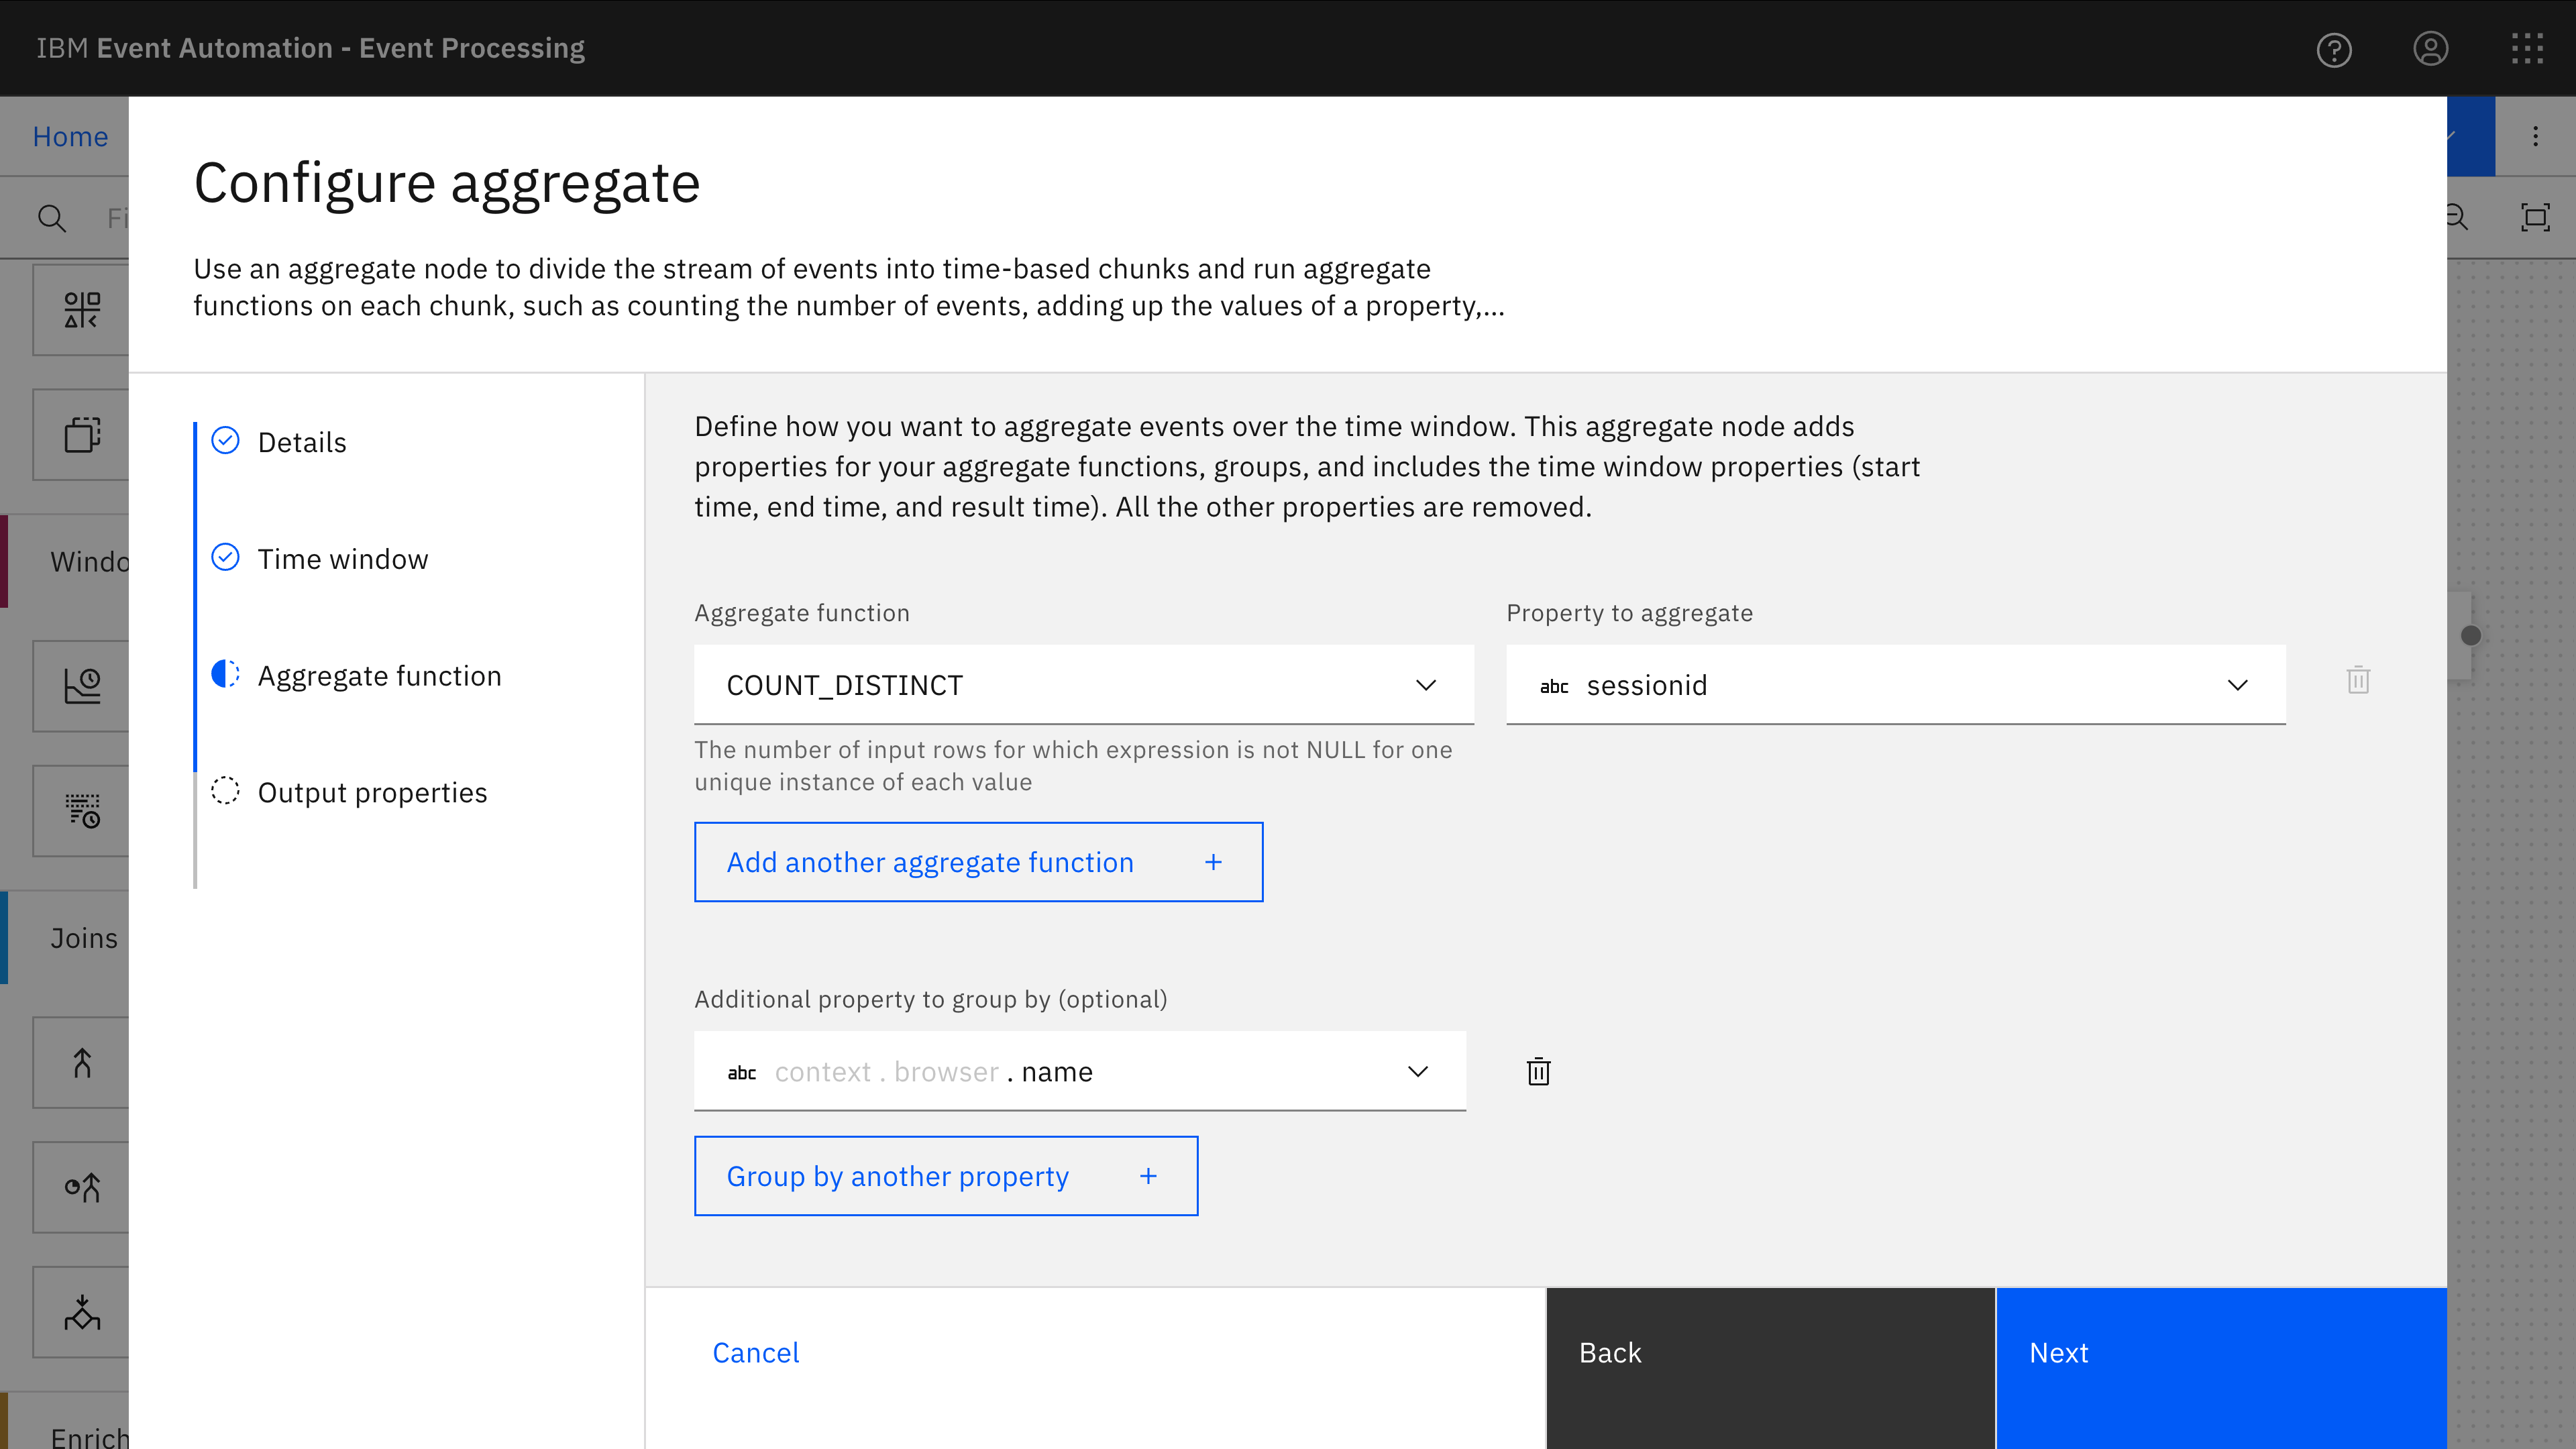
The second aggregate is another tumble window to count the number of different session ids that occur in each hour, grouped by the browser name (e.g. Chrome, Firefox, Safari, etc.).
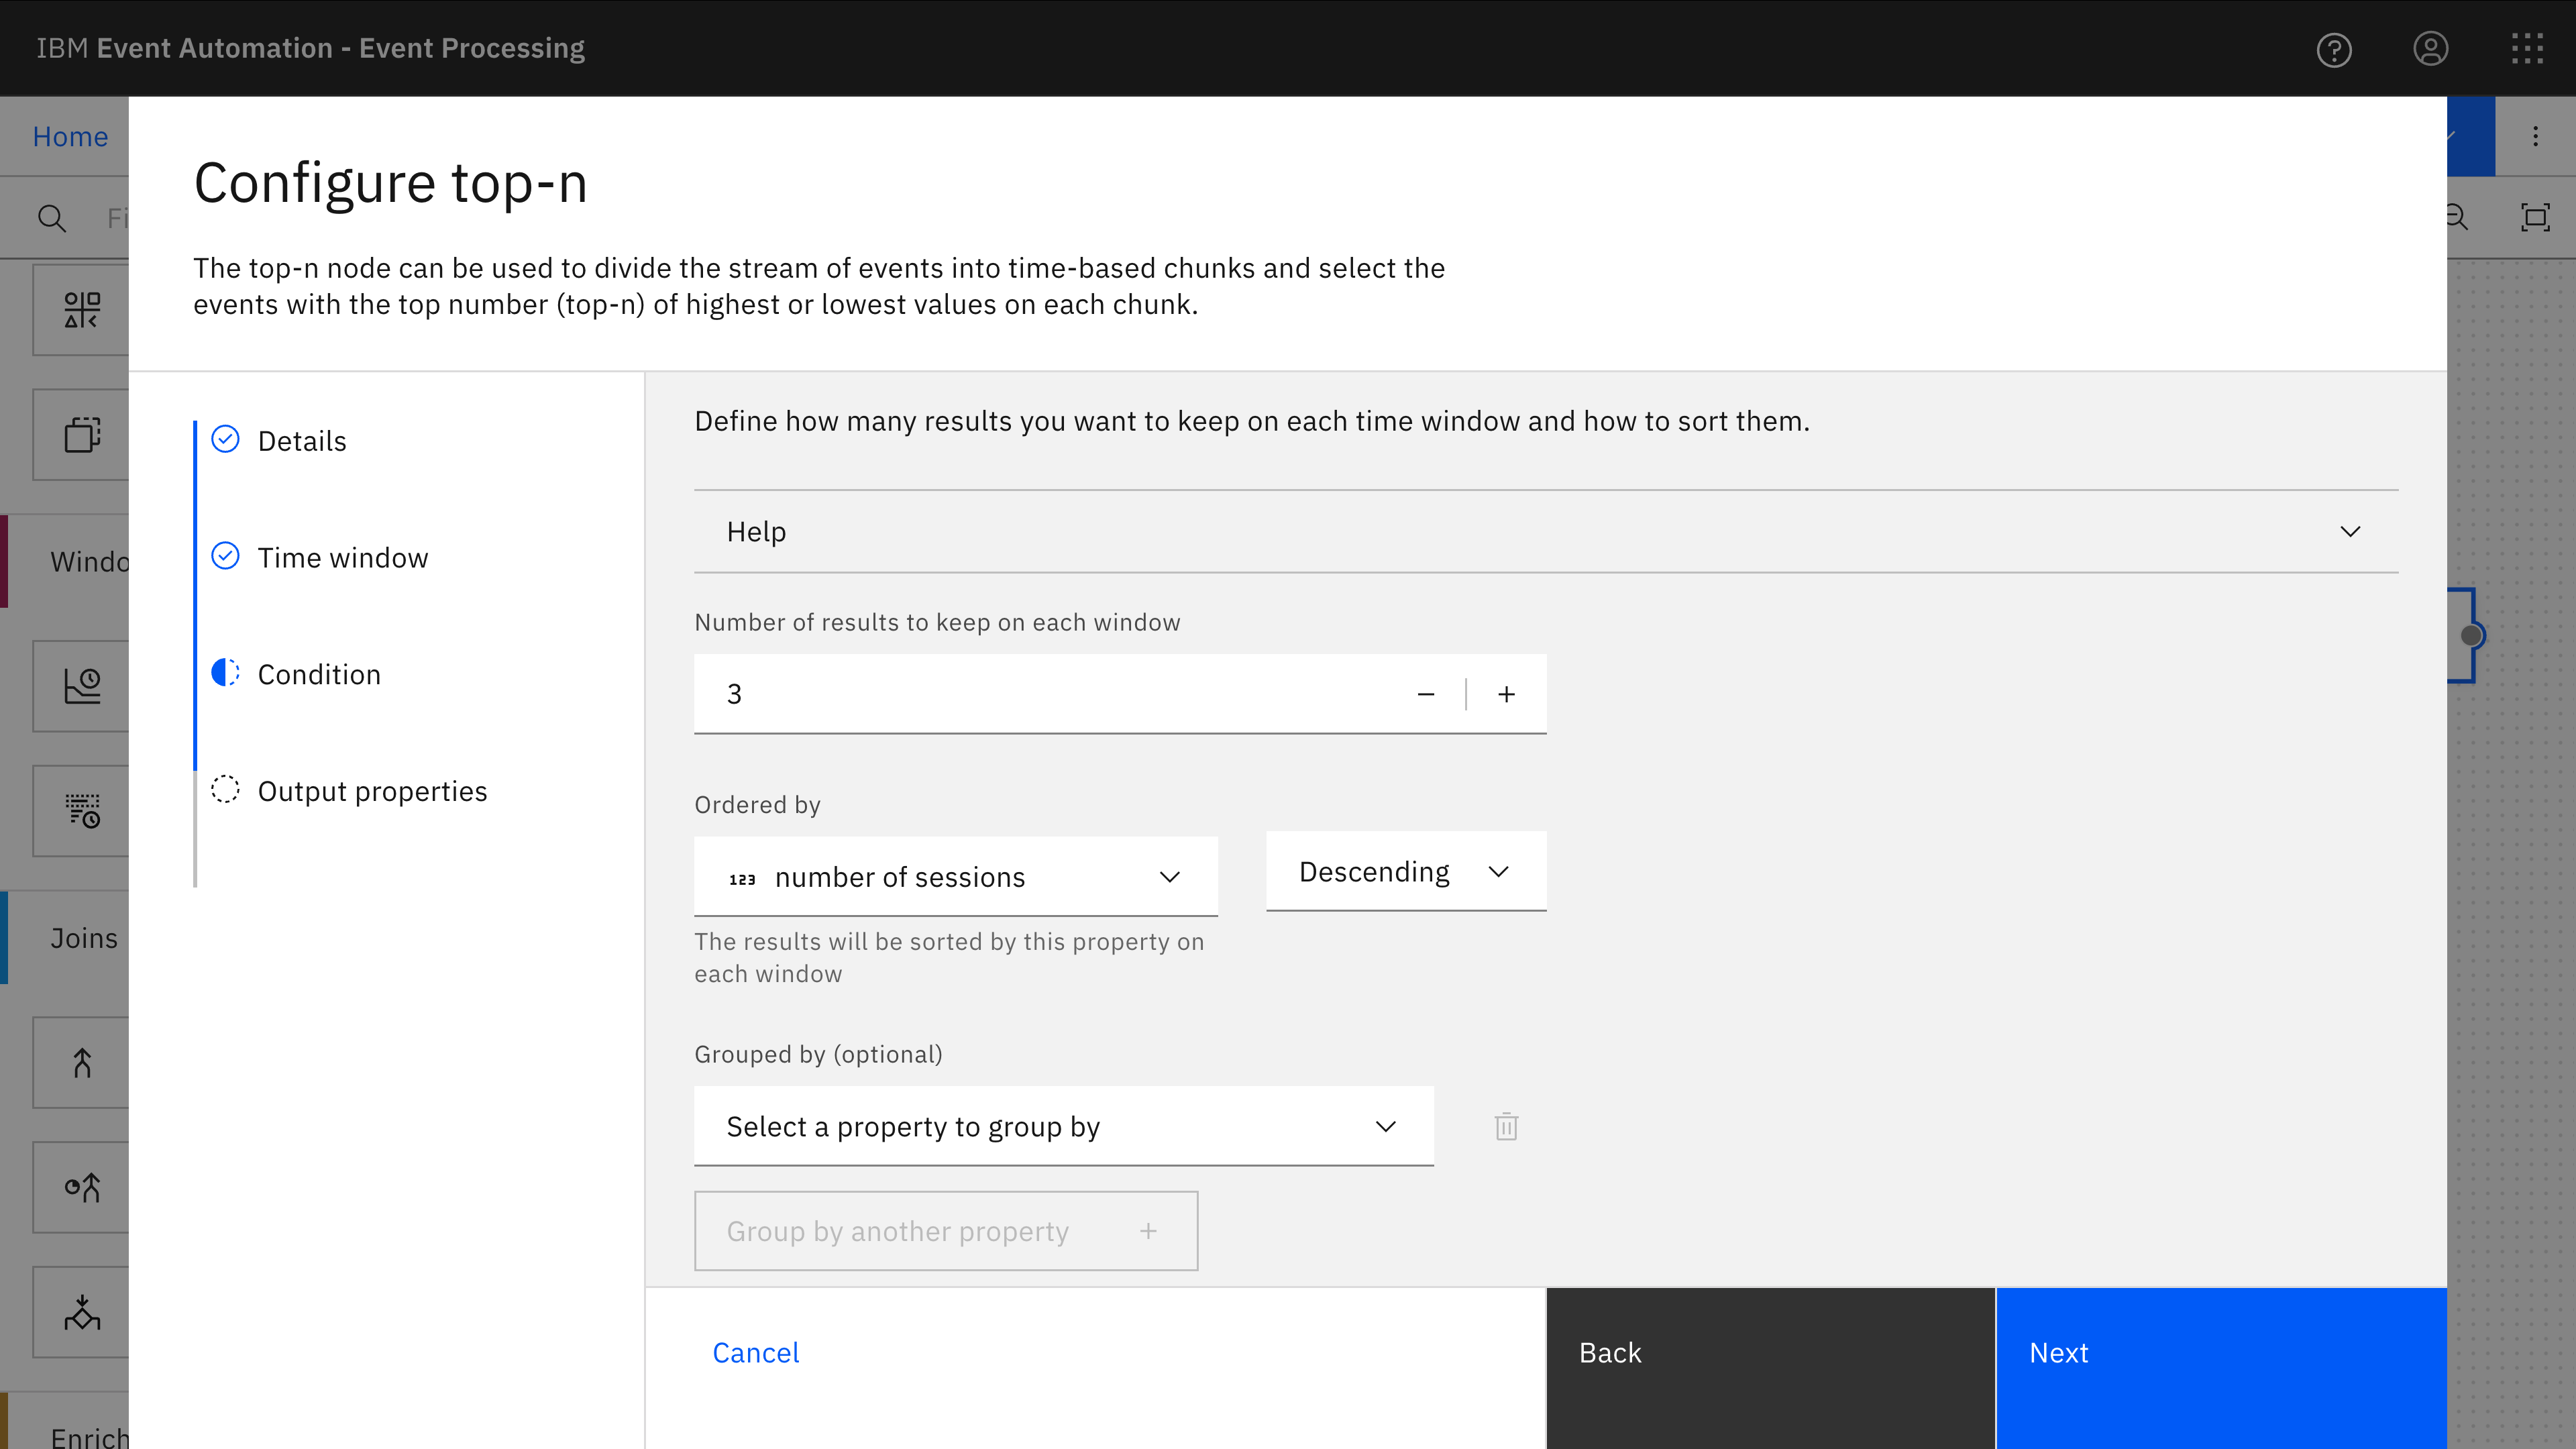
The Top-N query is added to the second aggregate, and configured so that the three browser names with the highest number of sessions are emitted at the end of each hour window.
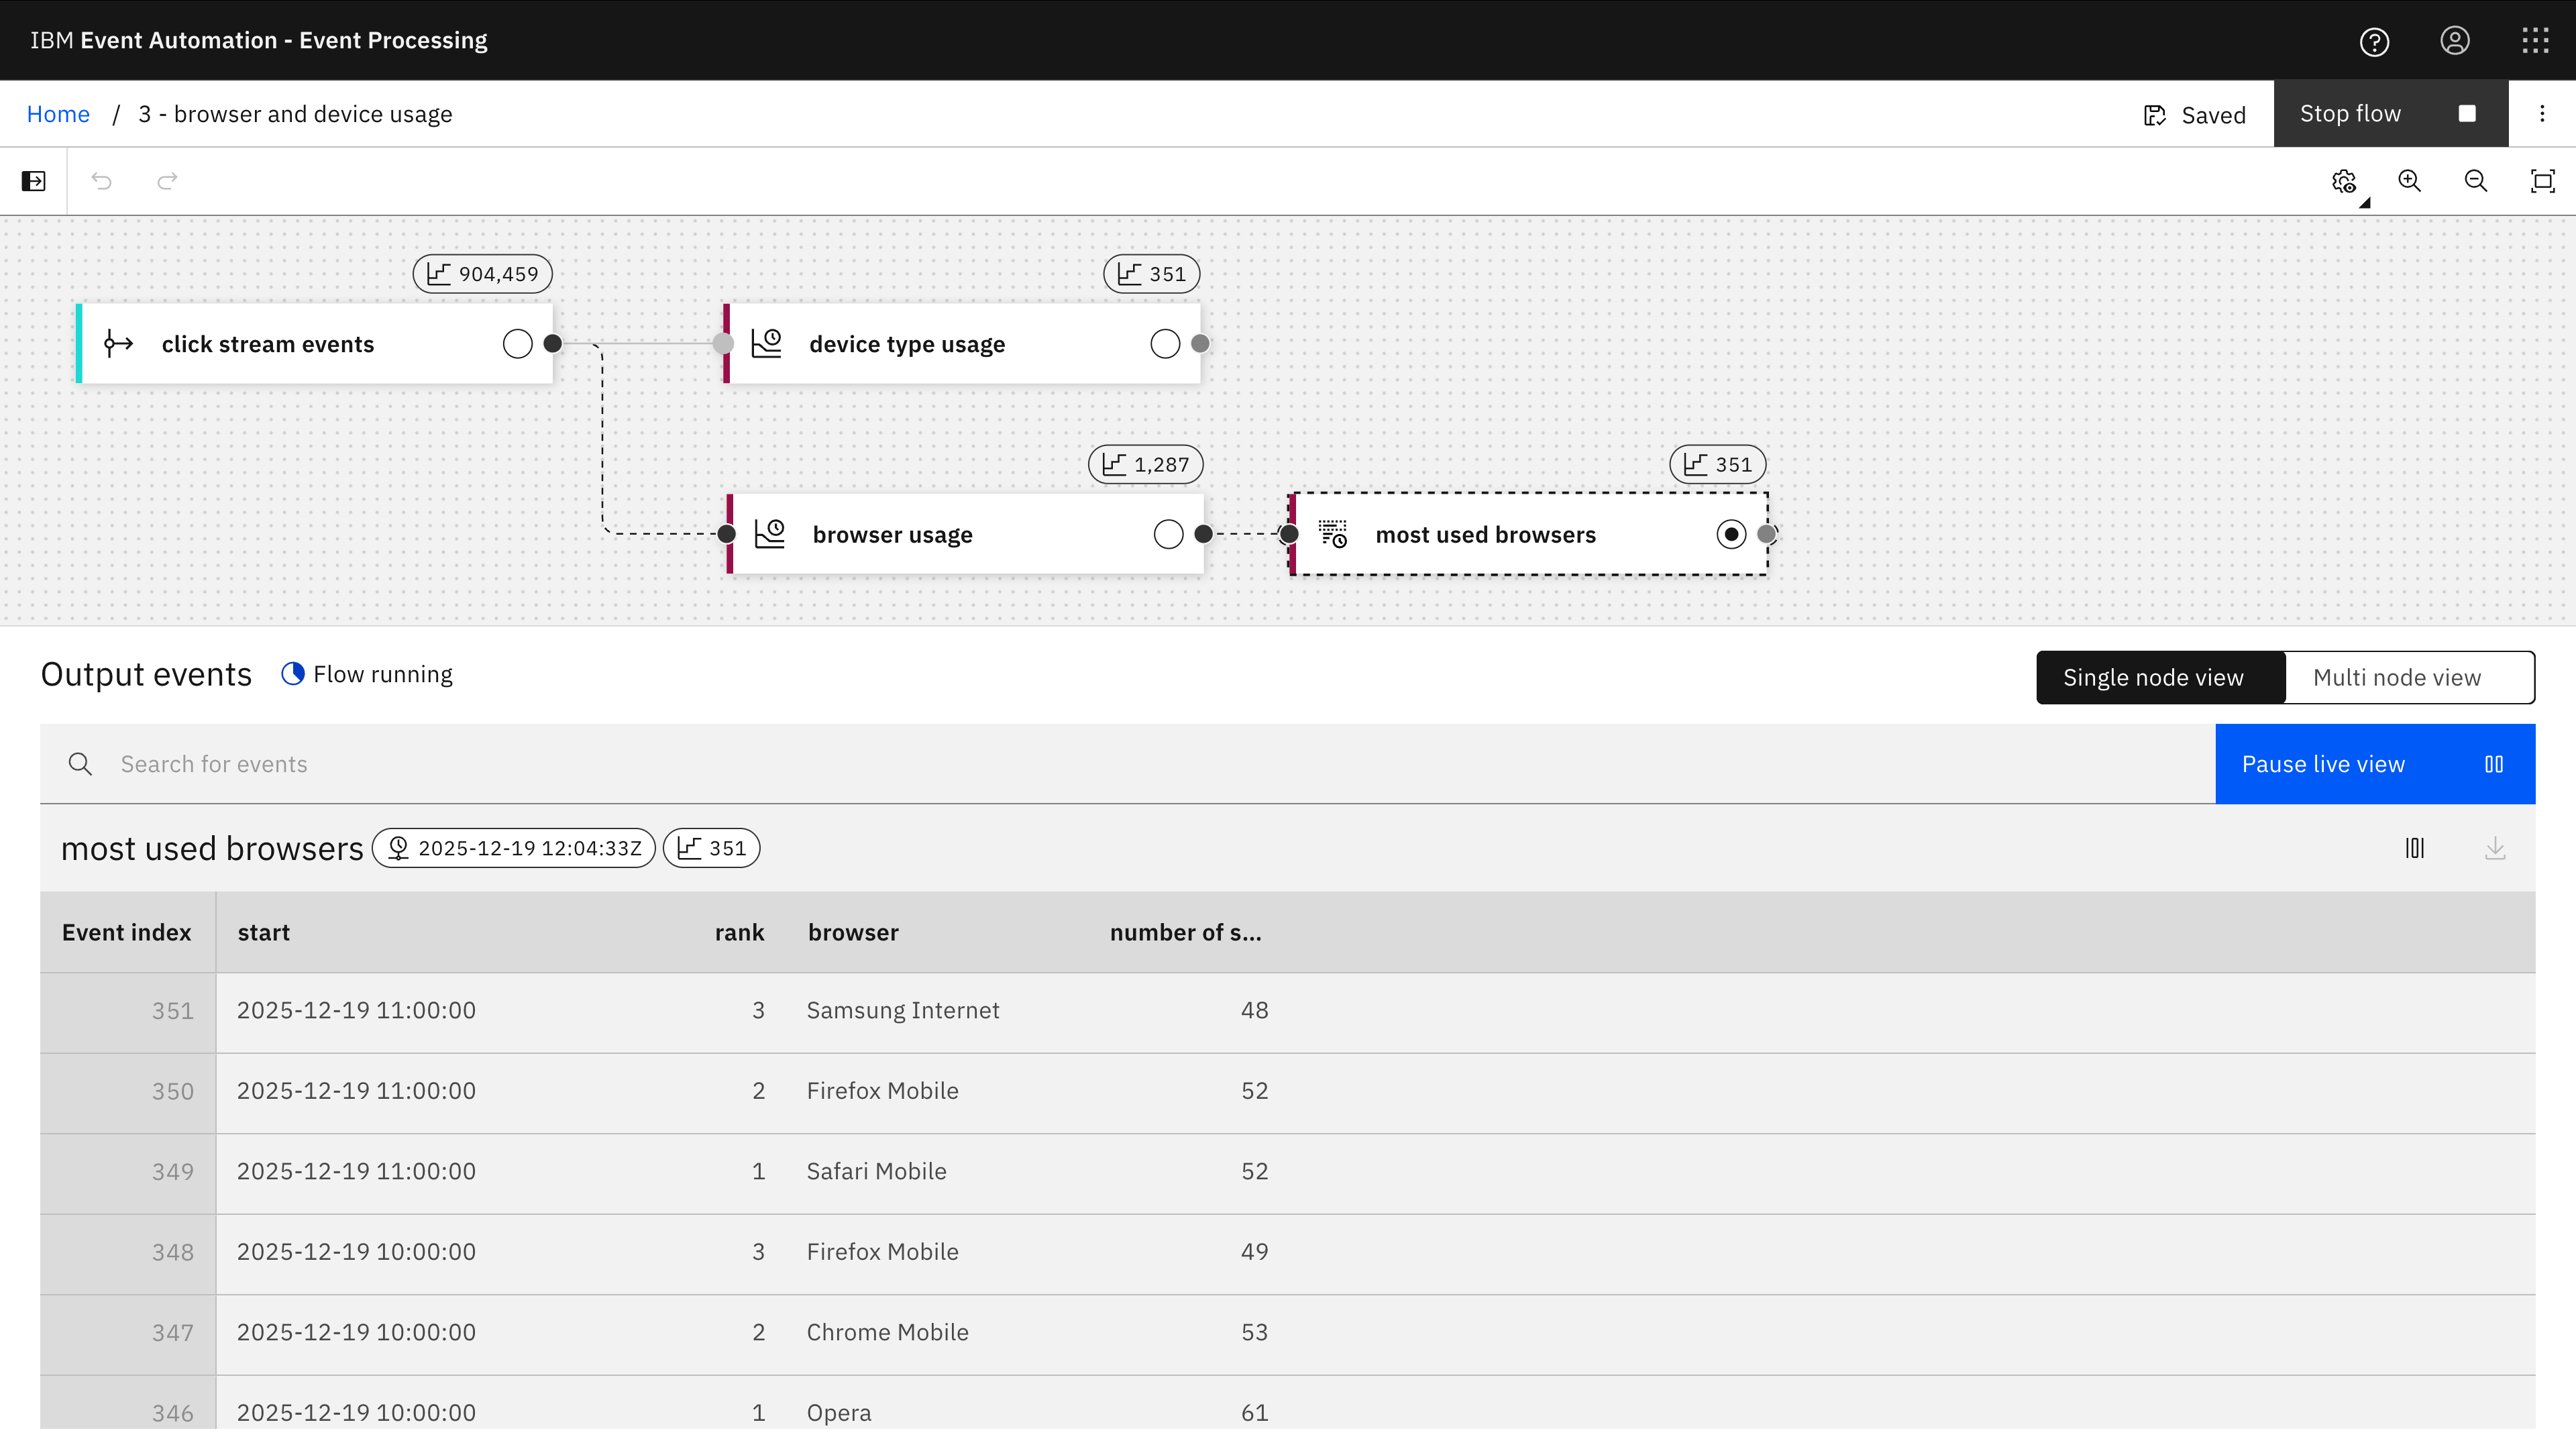
When the flow is running, it will output three events at the end of each hour – one for each of the three most-used browsers, with a count of how many unique session shave been observed with that browser during the hour.
The second aggregate (most used browser for each hour) is in lines 102-158. I’ve added some comments to explain what it is doing.
4 User session duration
Demonstrating how to aggregate events using a session window to identify click tracking events from the same user as part of the same user session.
Demonstrating how to aggregate those user sessions using a tumble window to identify the attributes of an average user session.
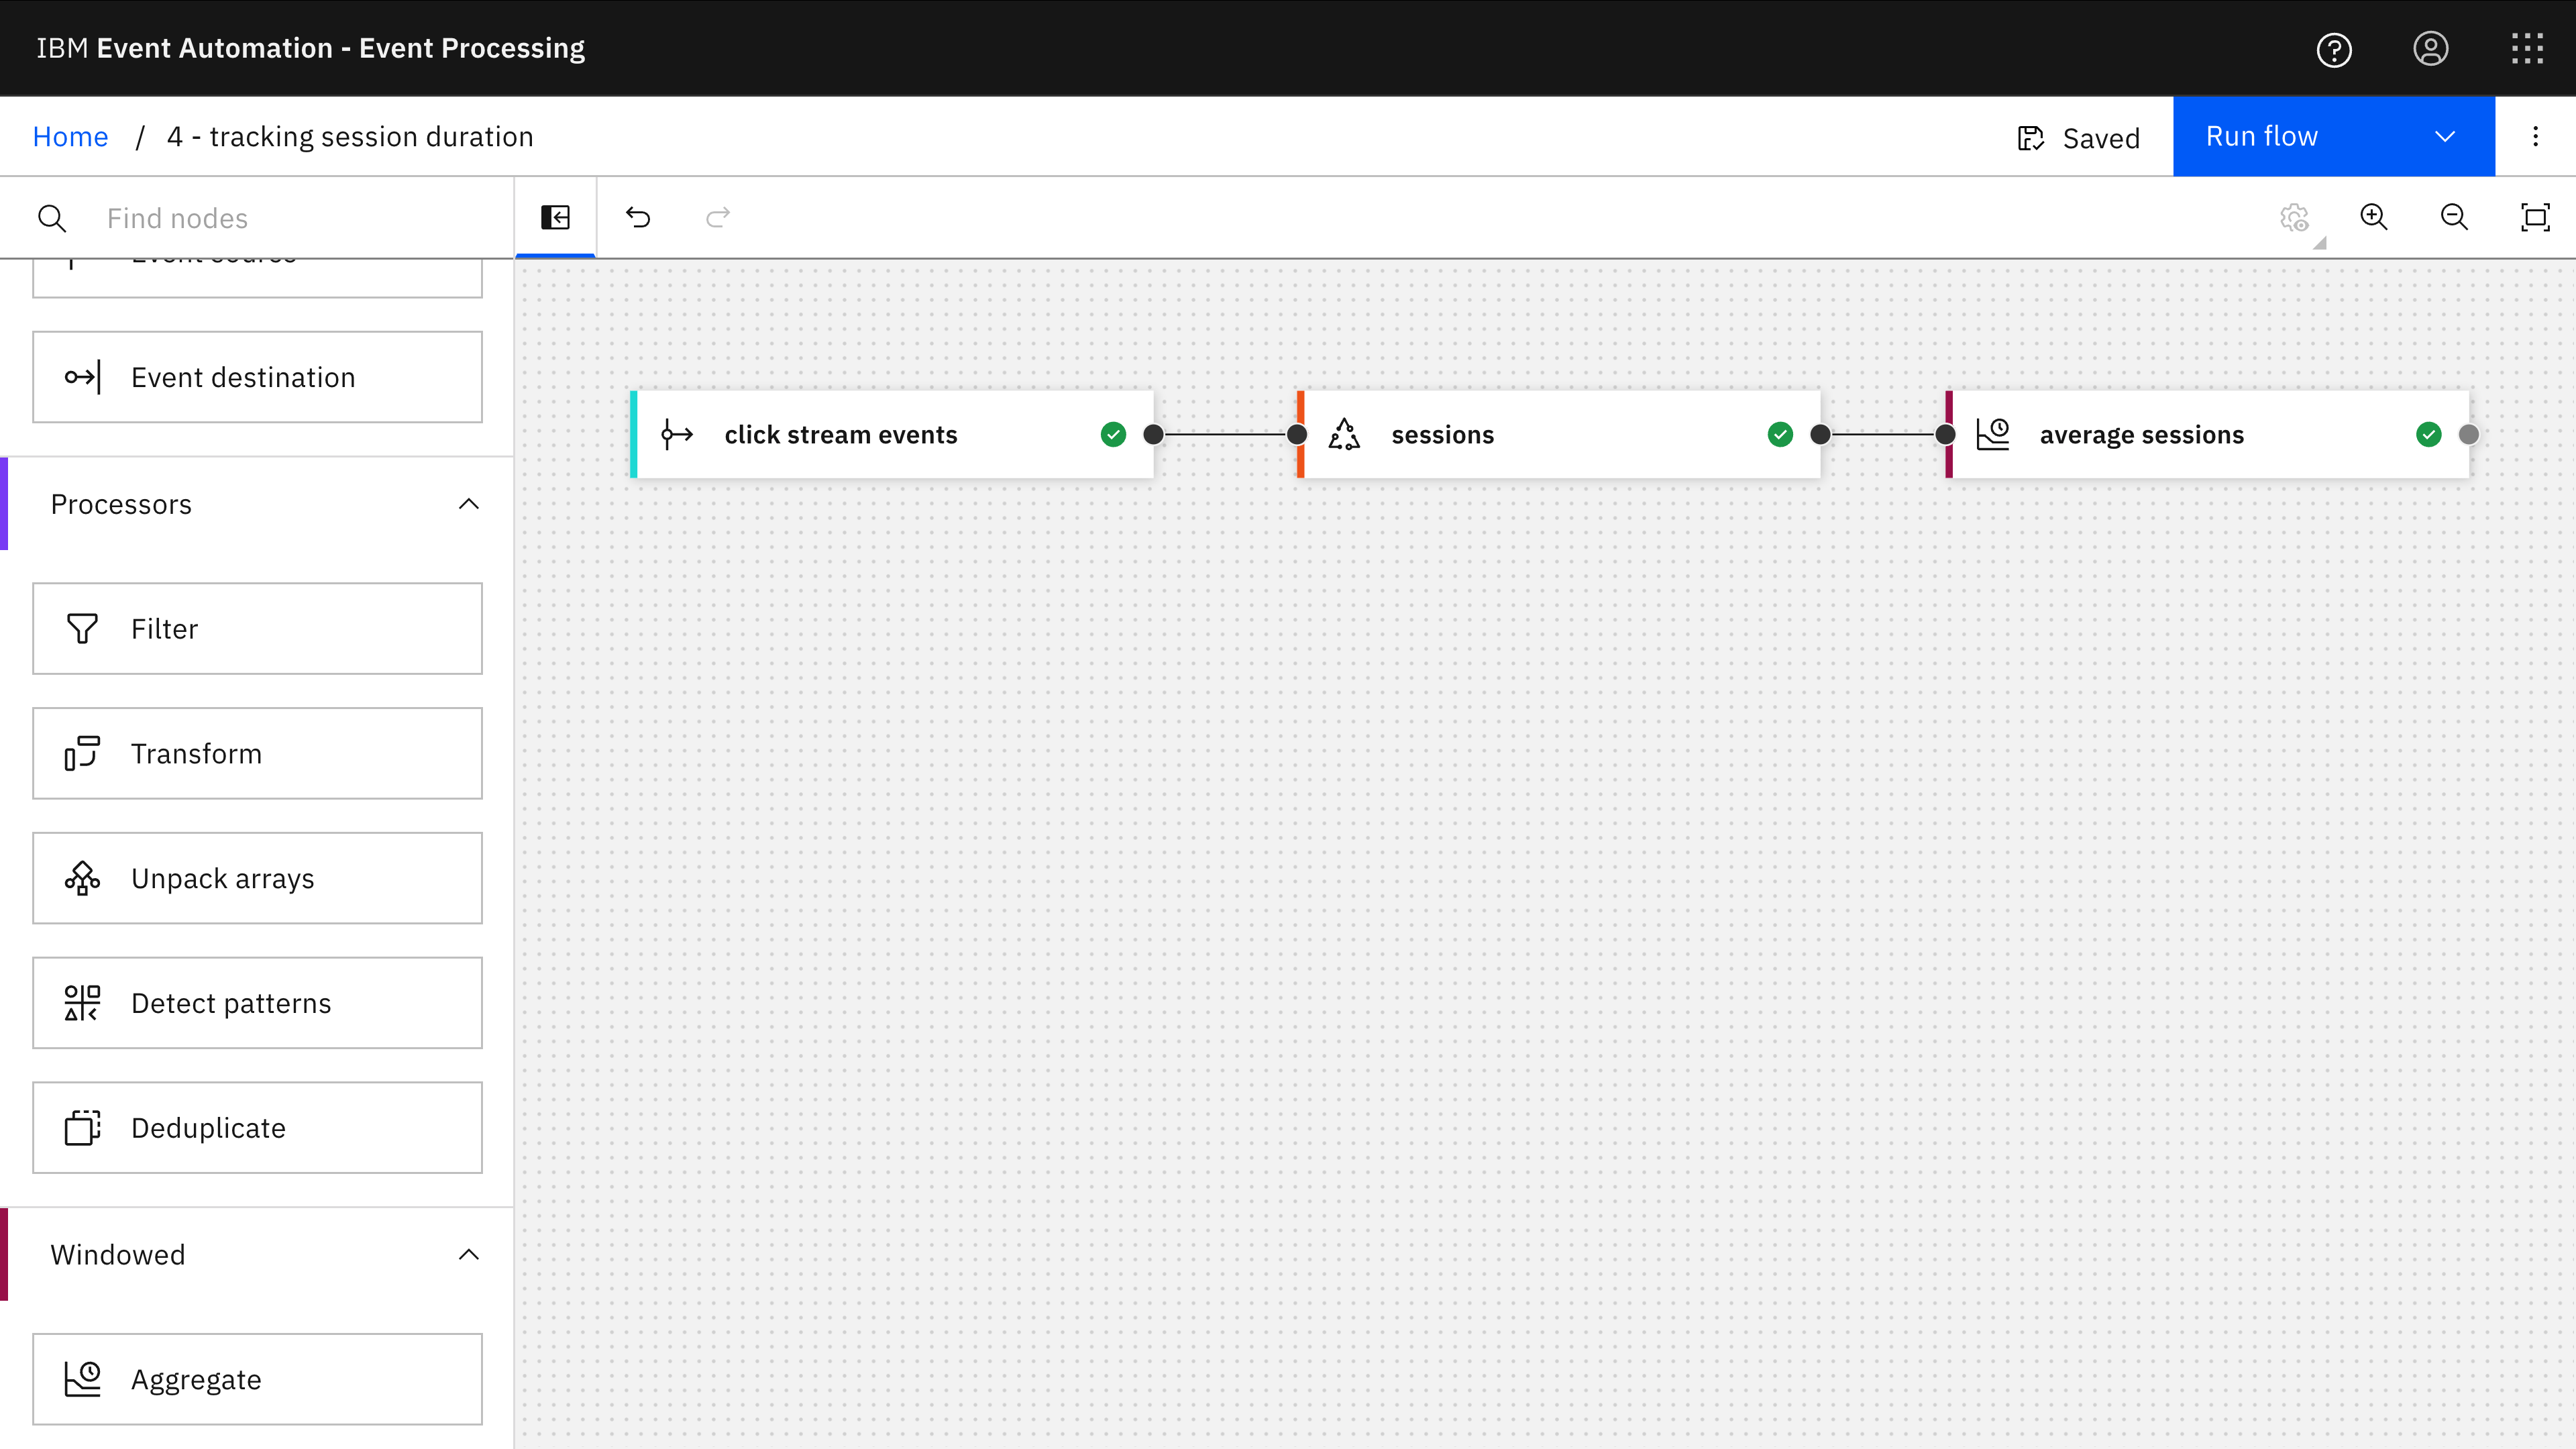
The Event Processing project for this example uses two aggregate nodes.
The first aggregate node collects individual click events into complete user sessions – all of the clicks that a user performed as part of a single active session.
The SQL for this first aggregate is at 4-aggregate-session.sql (lines 72-100) with comments added to explain what it is doing.
I’m calculating the duration of each user session by using a TIMESTAMPDIFF function to compute the difference between the timestamps for the first and last click tracking event observed with each sessionid.
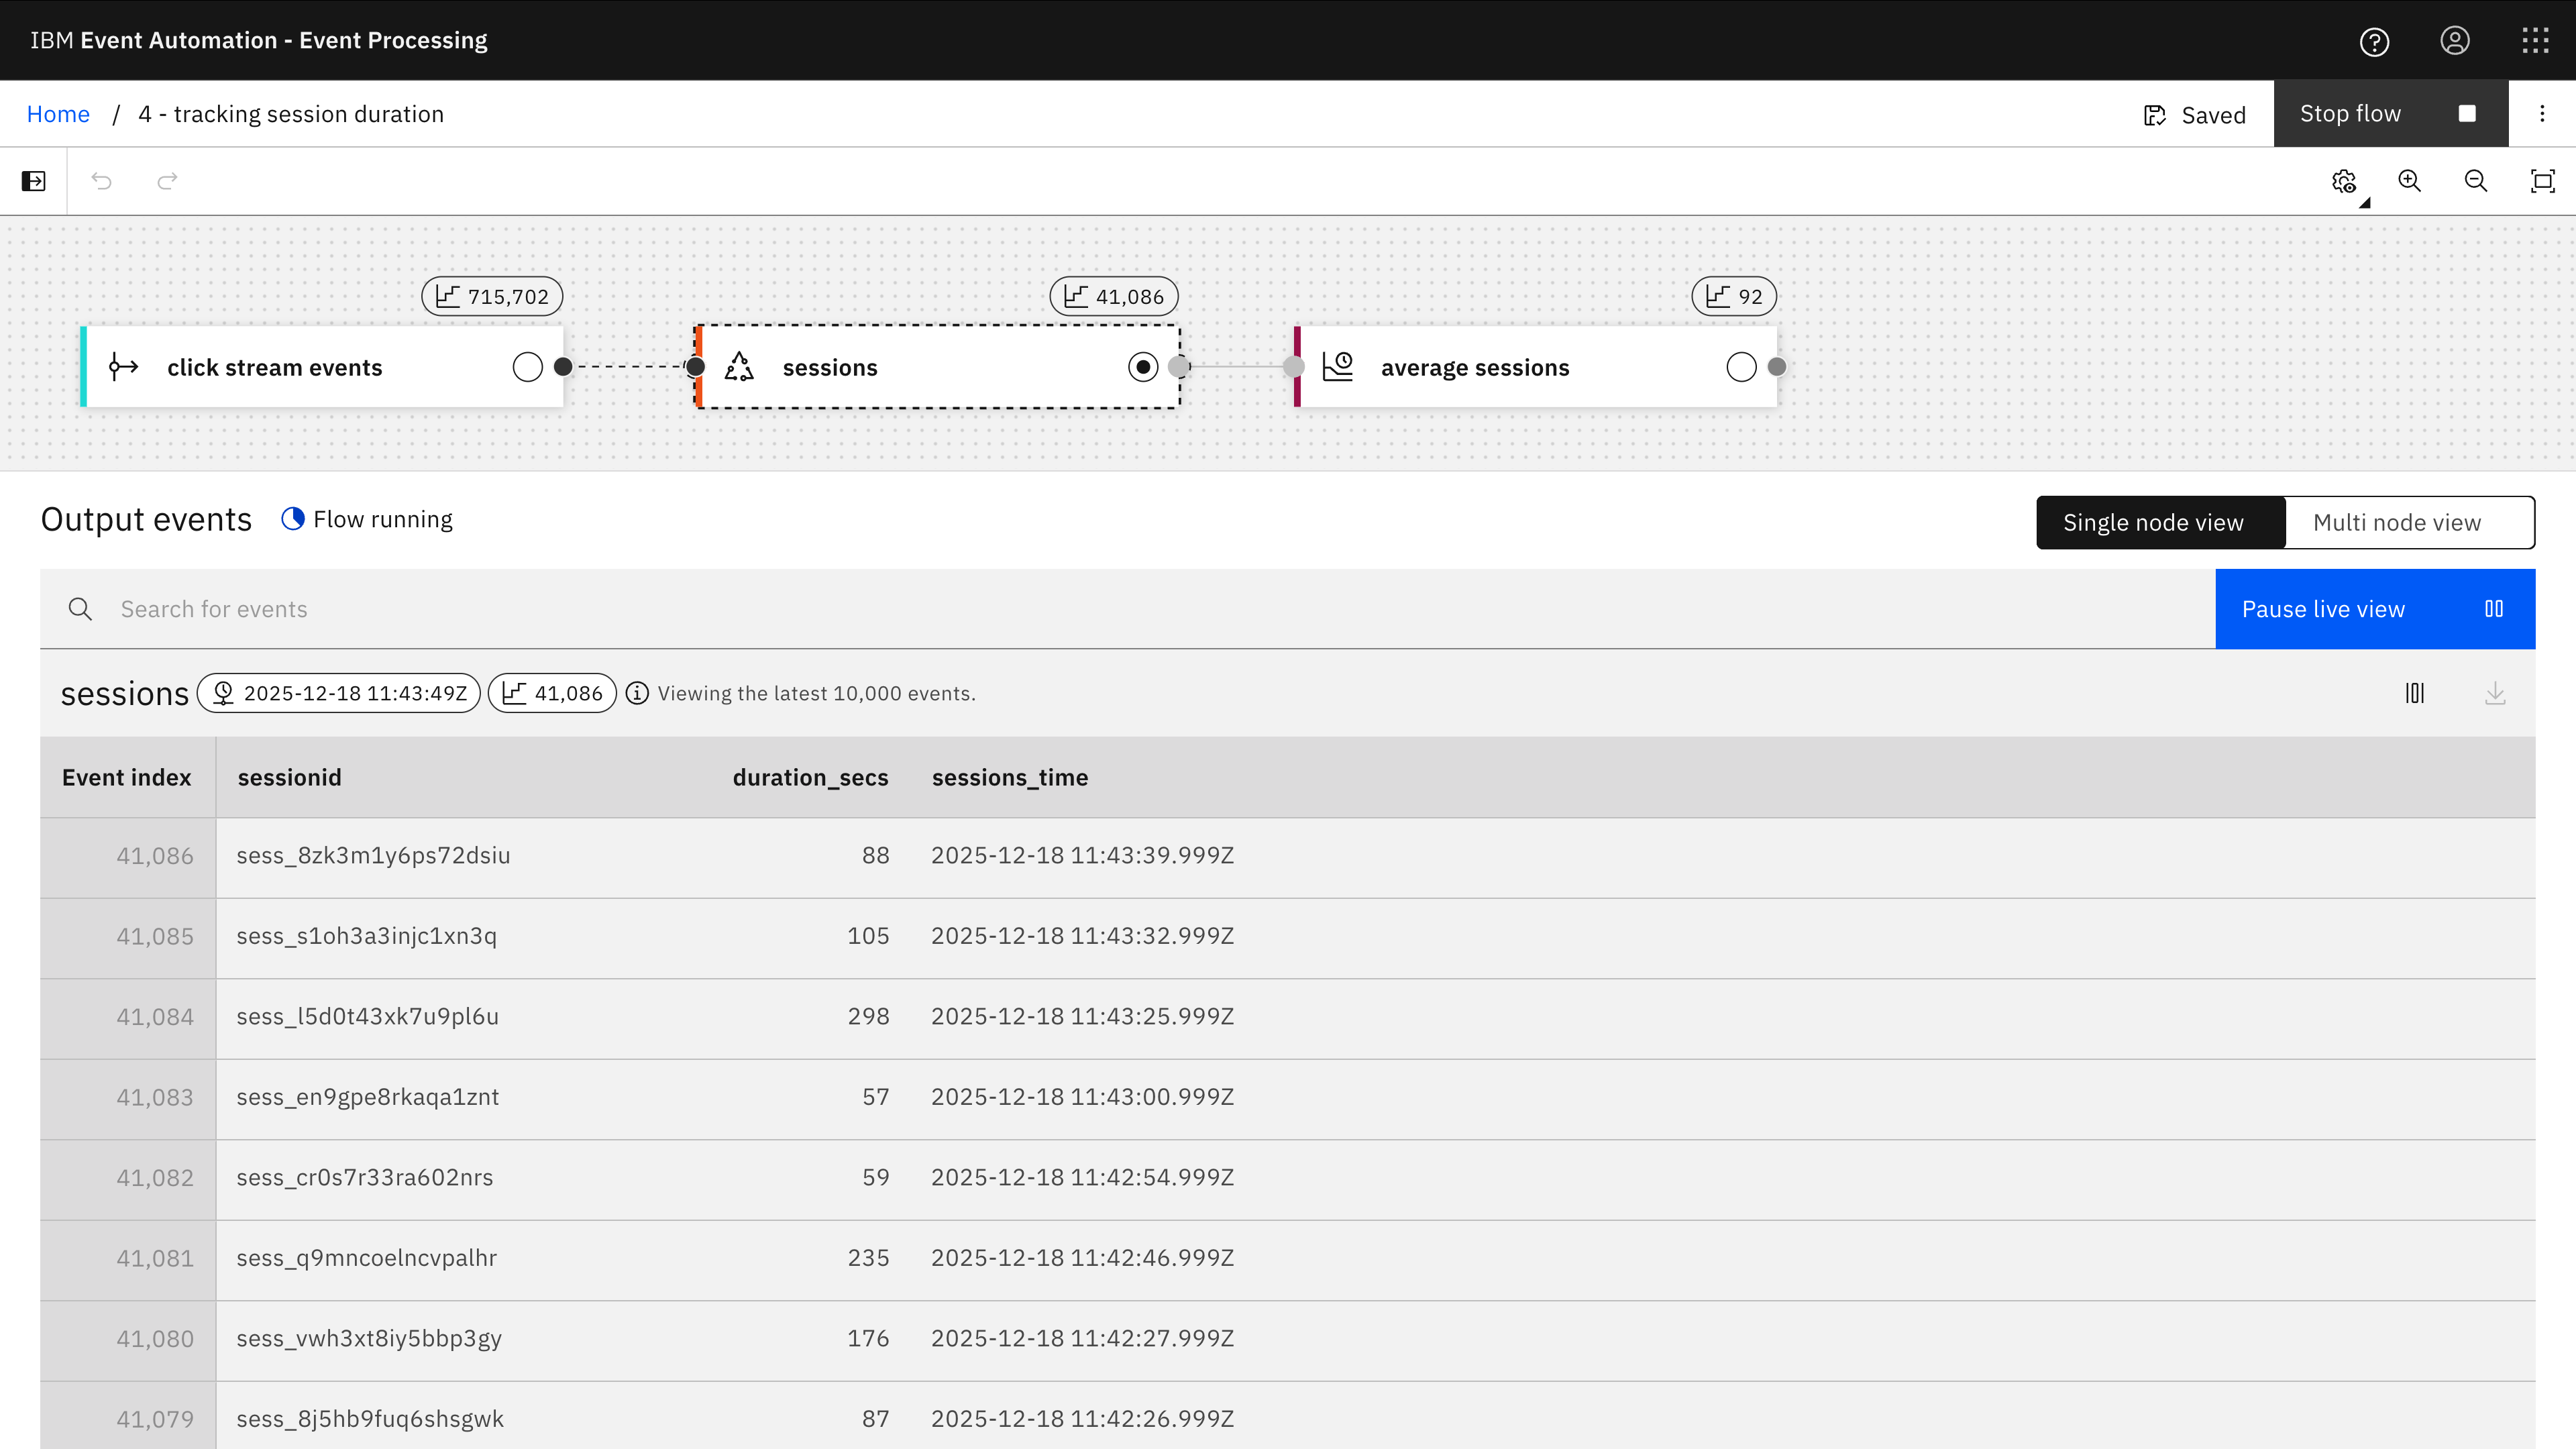
The result from this is that every time a session discontinues (which I’ve defined as “no events with that session id being received for 15 minutes”) an event is emitted with the duration of that session.
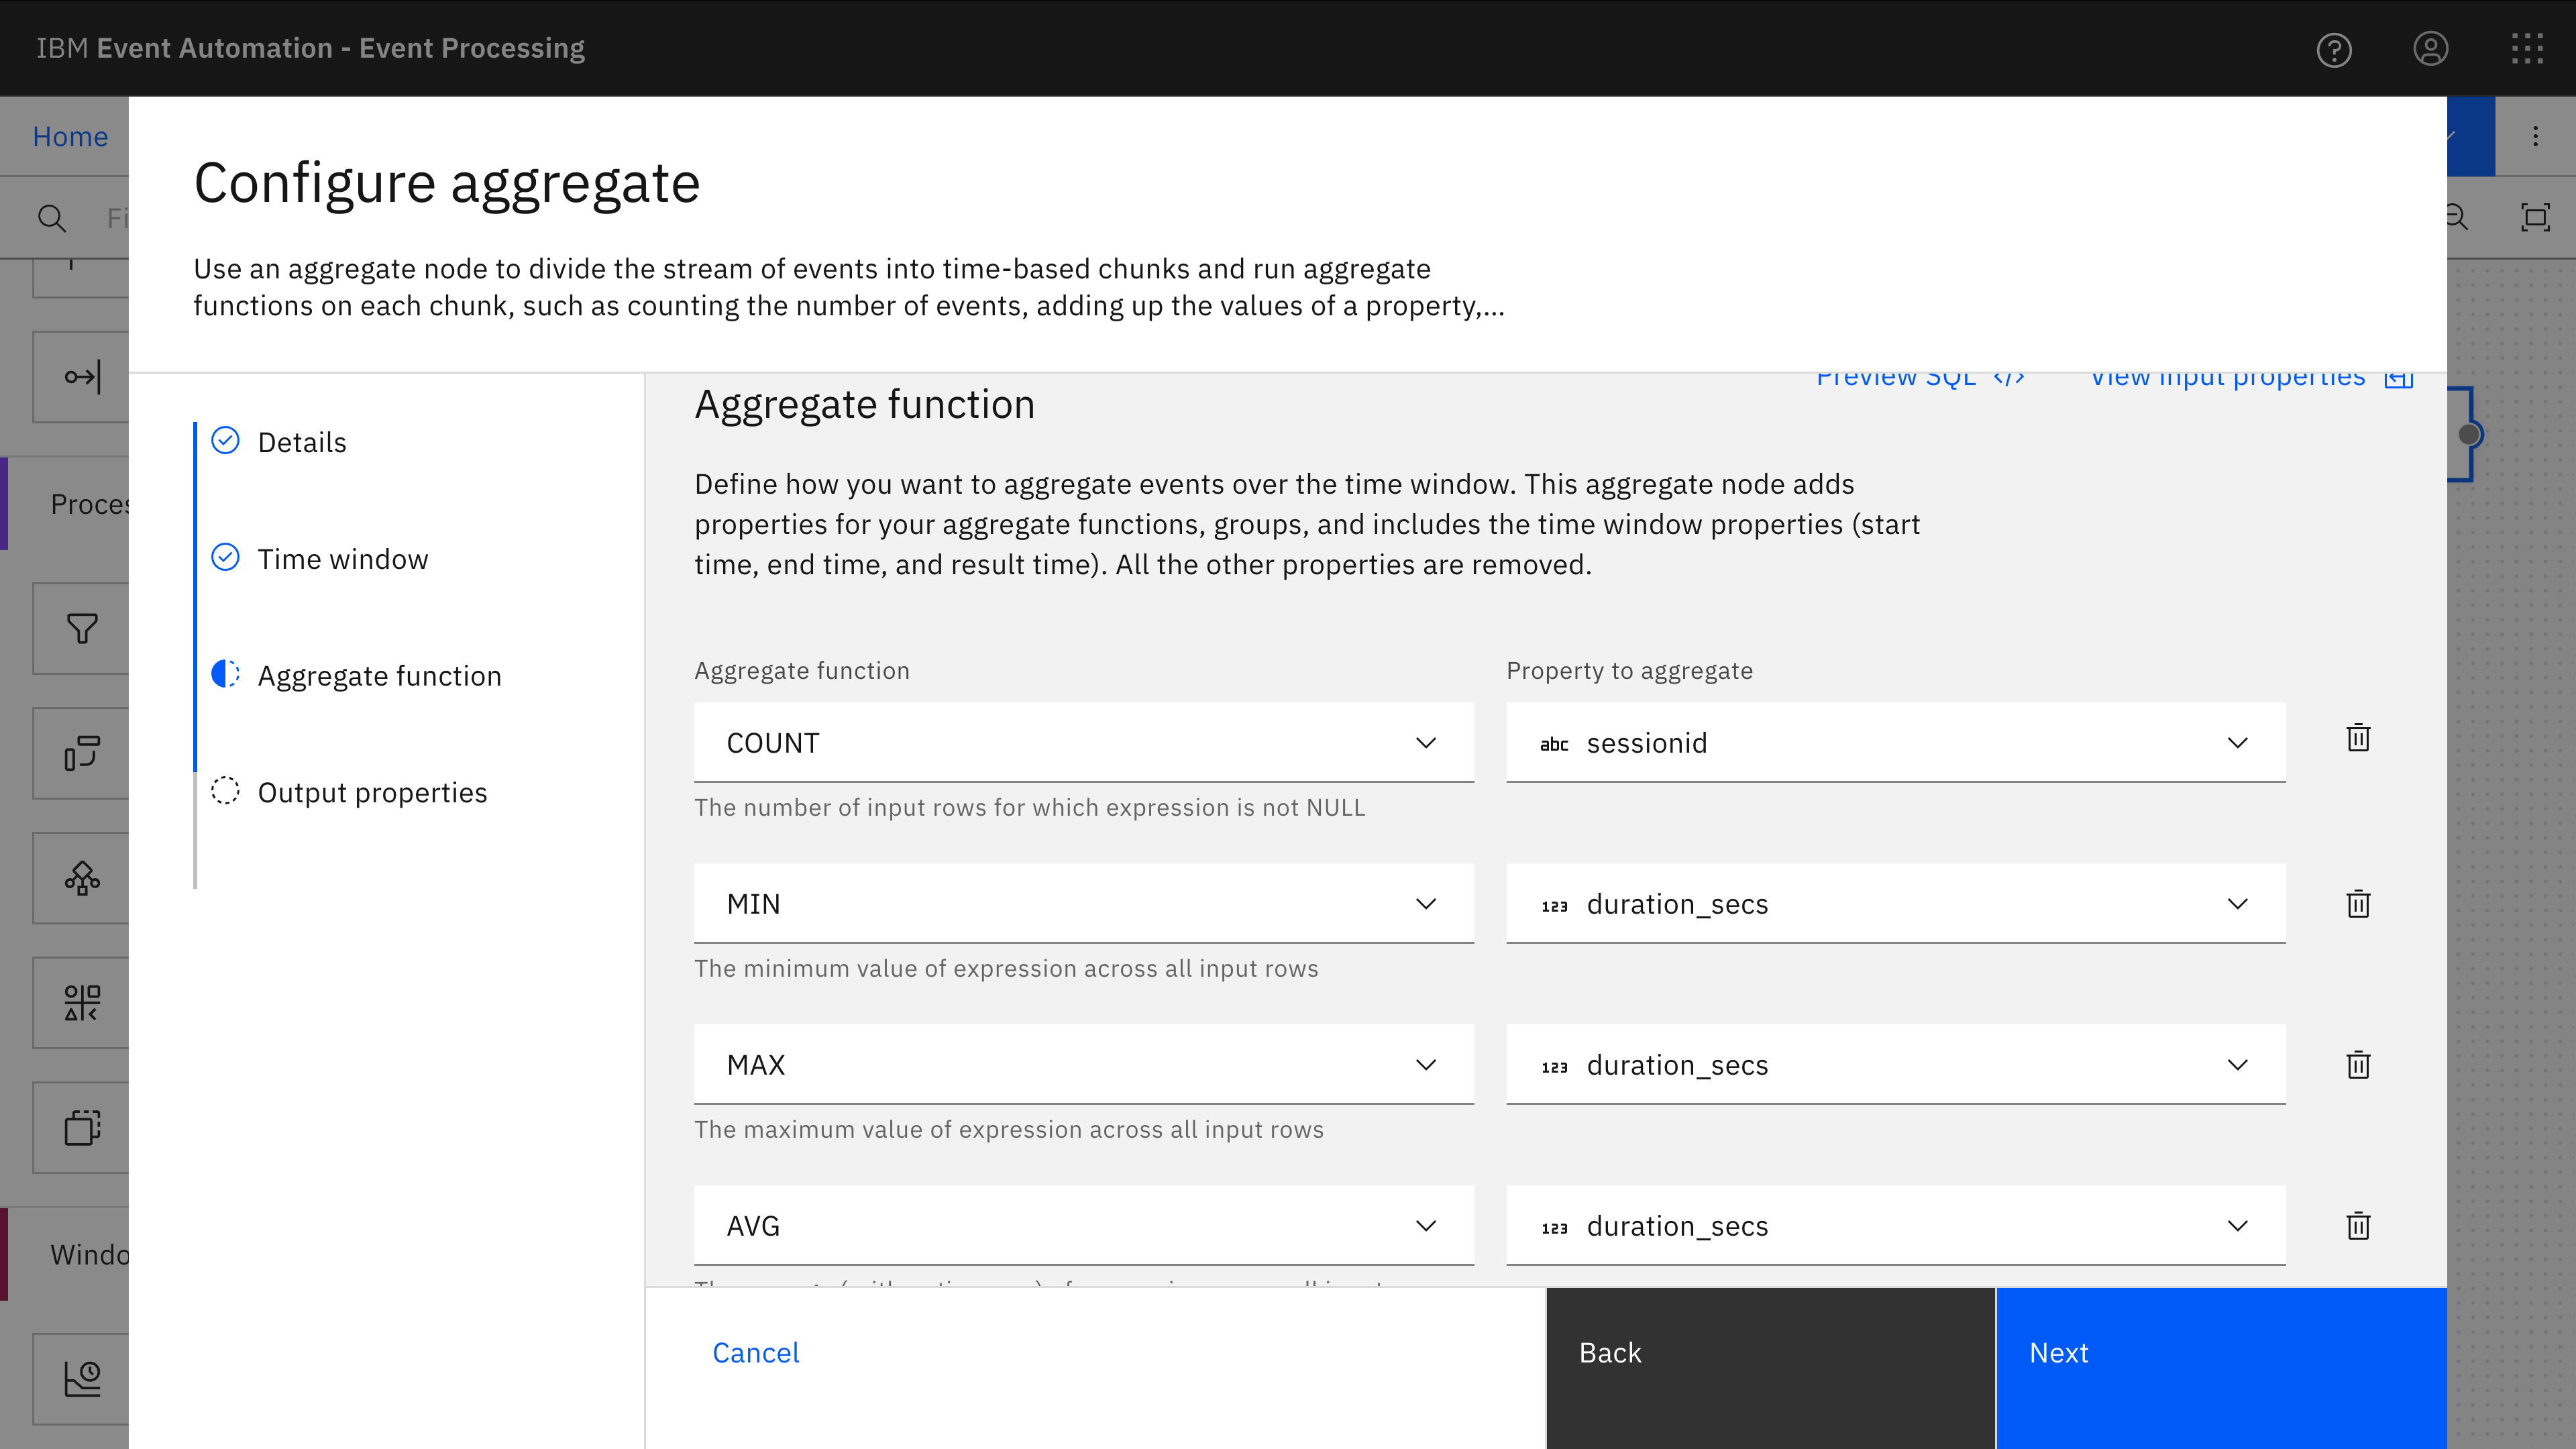
The second aggregate node takes those individual session durations, and counts the number of sessions, identifies the longest and shortest session that was recorded during each hour, and calculates the average session duration.
The SQL for this second aggregate is at 4-aggregate-session.sql (lines 109-133) with comments addded to explain what it is doing.
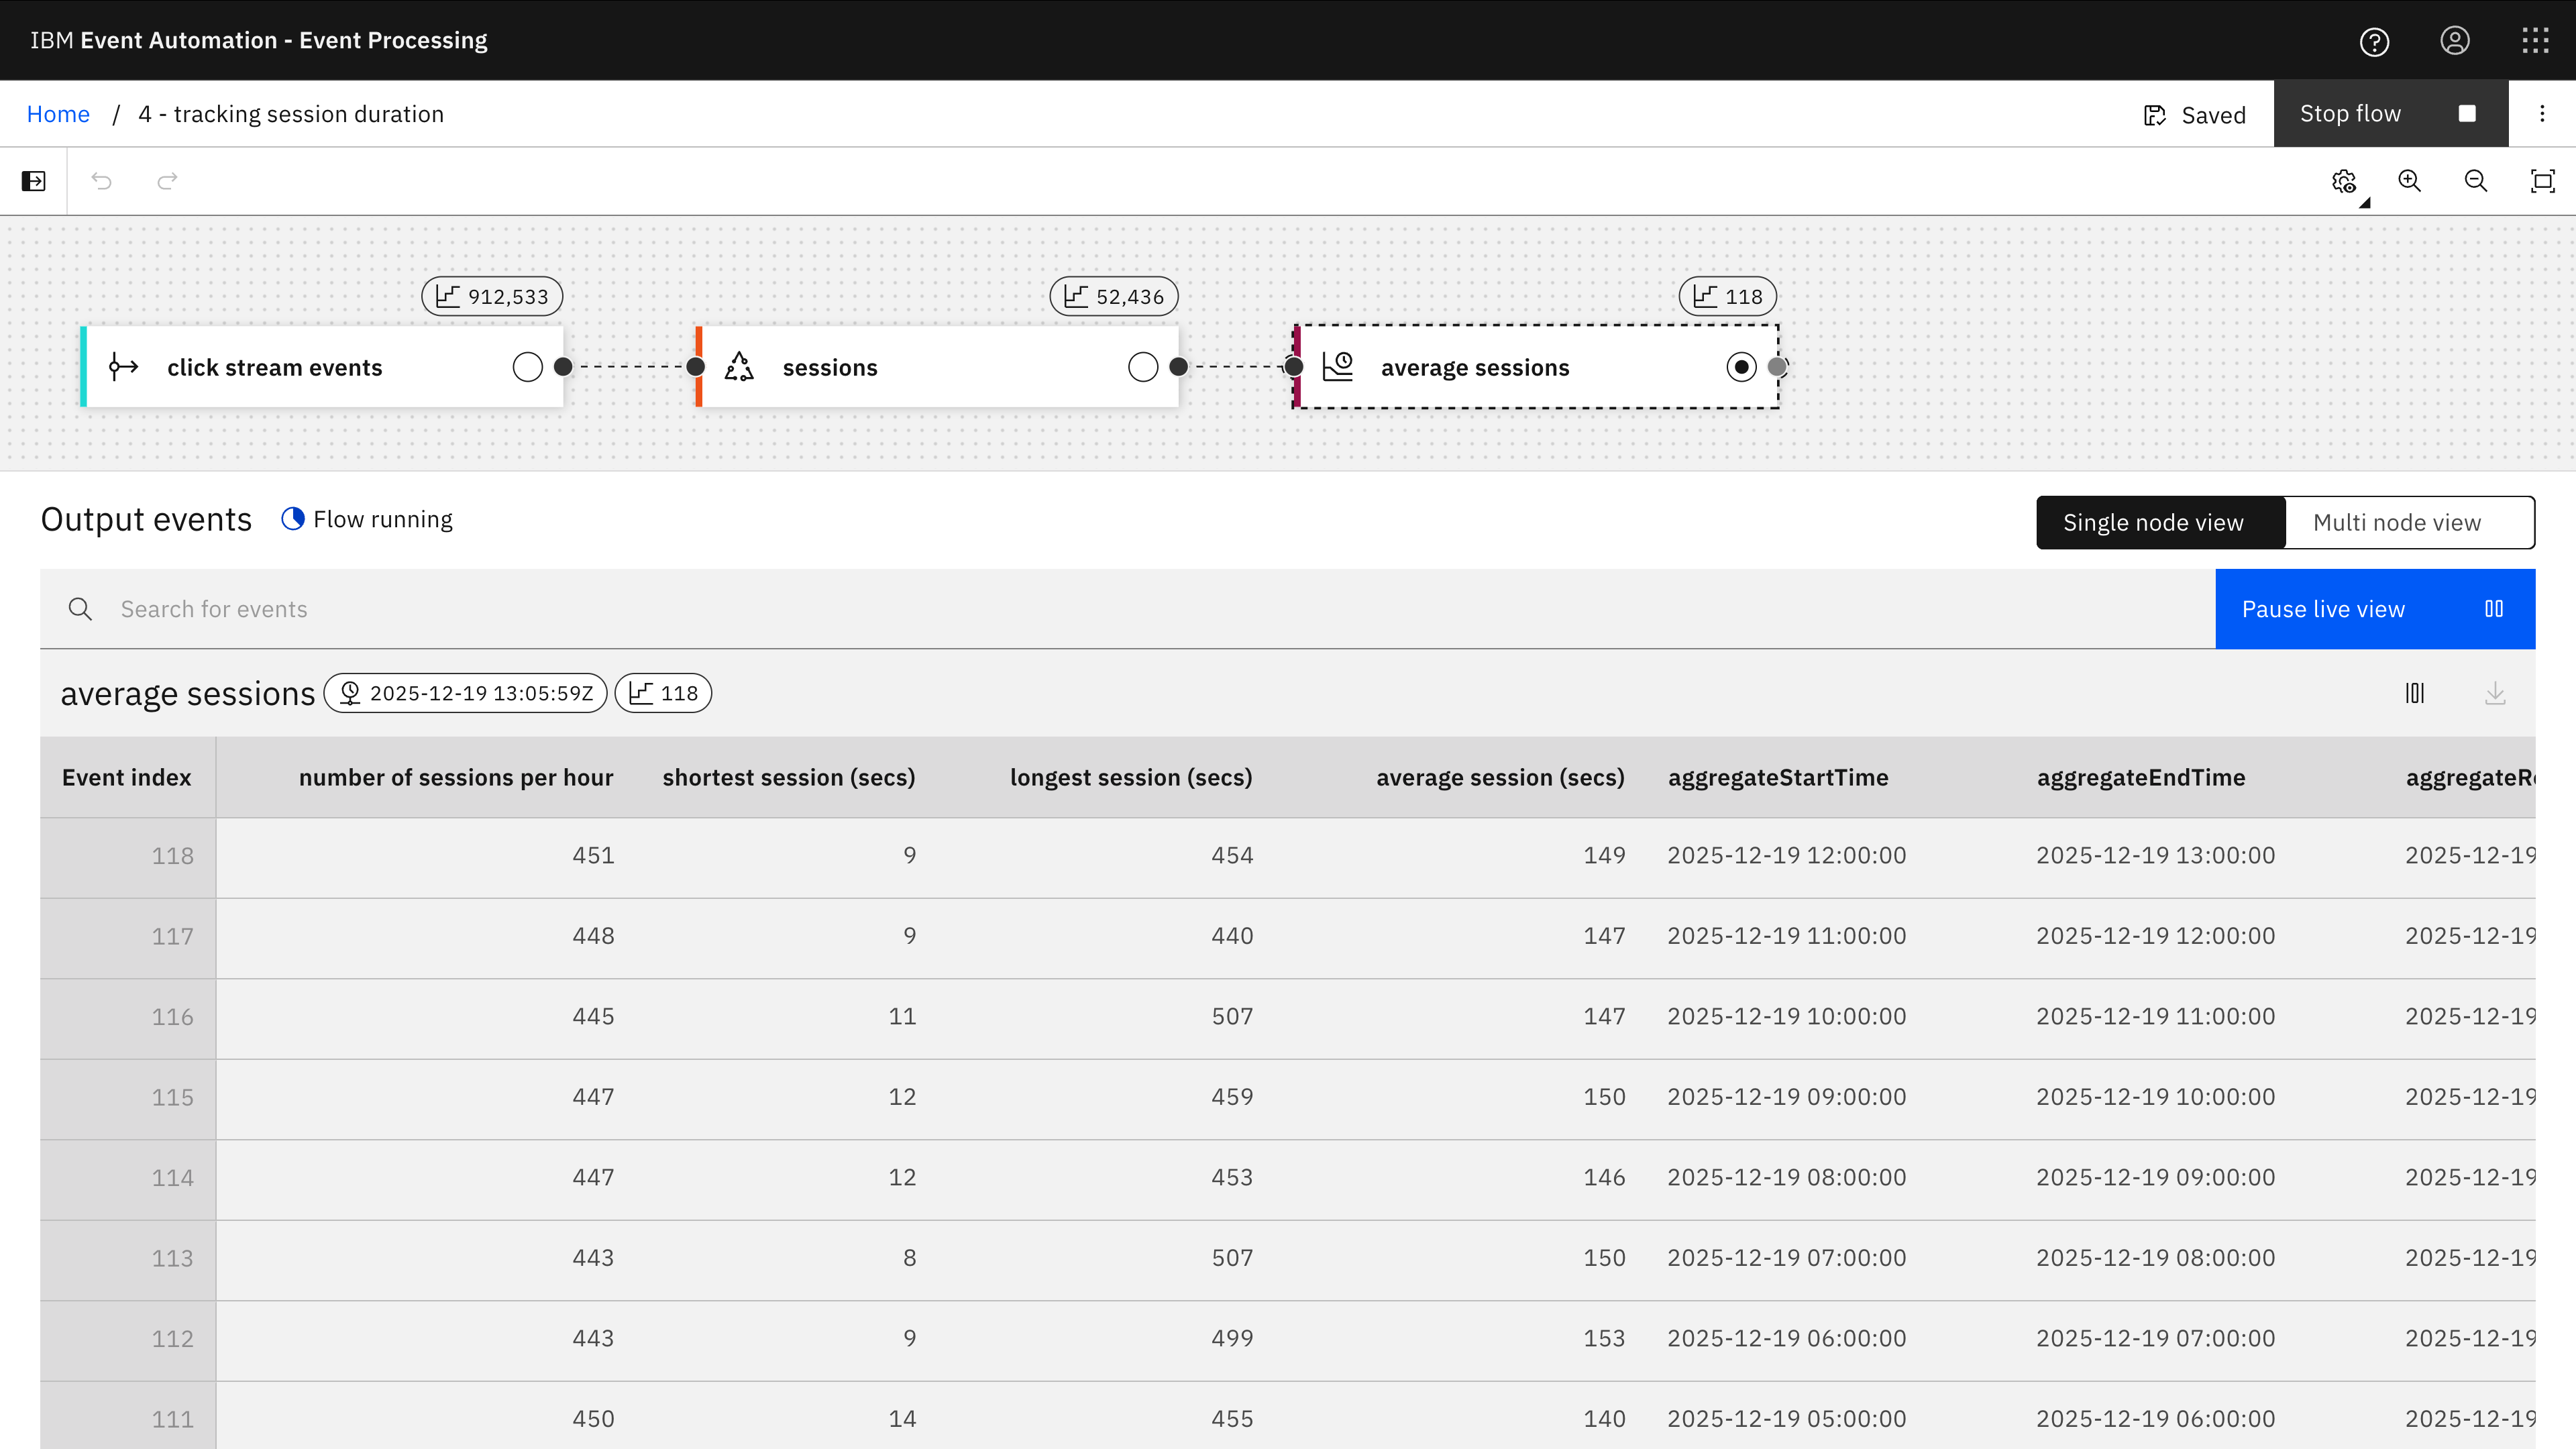
The result from this is that at the end of every hour, an event is emitted with the number of user sessions observed in the previous hour of click tracking events, the shortest and longest user session, and the average user session duration.
5 Abandoned baskets
Demonstrating how to filter sessions that match certain criteria to identify user sessions that included adding products to a shopping cart but that did not result in a purchase.
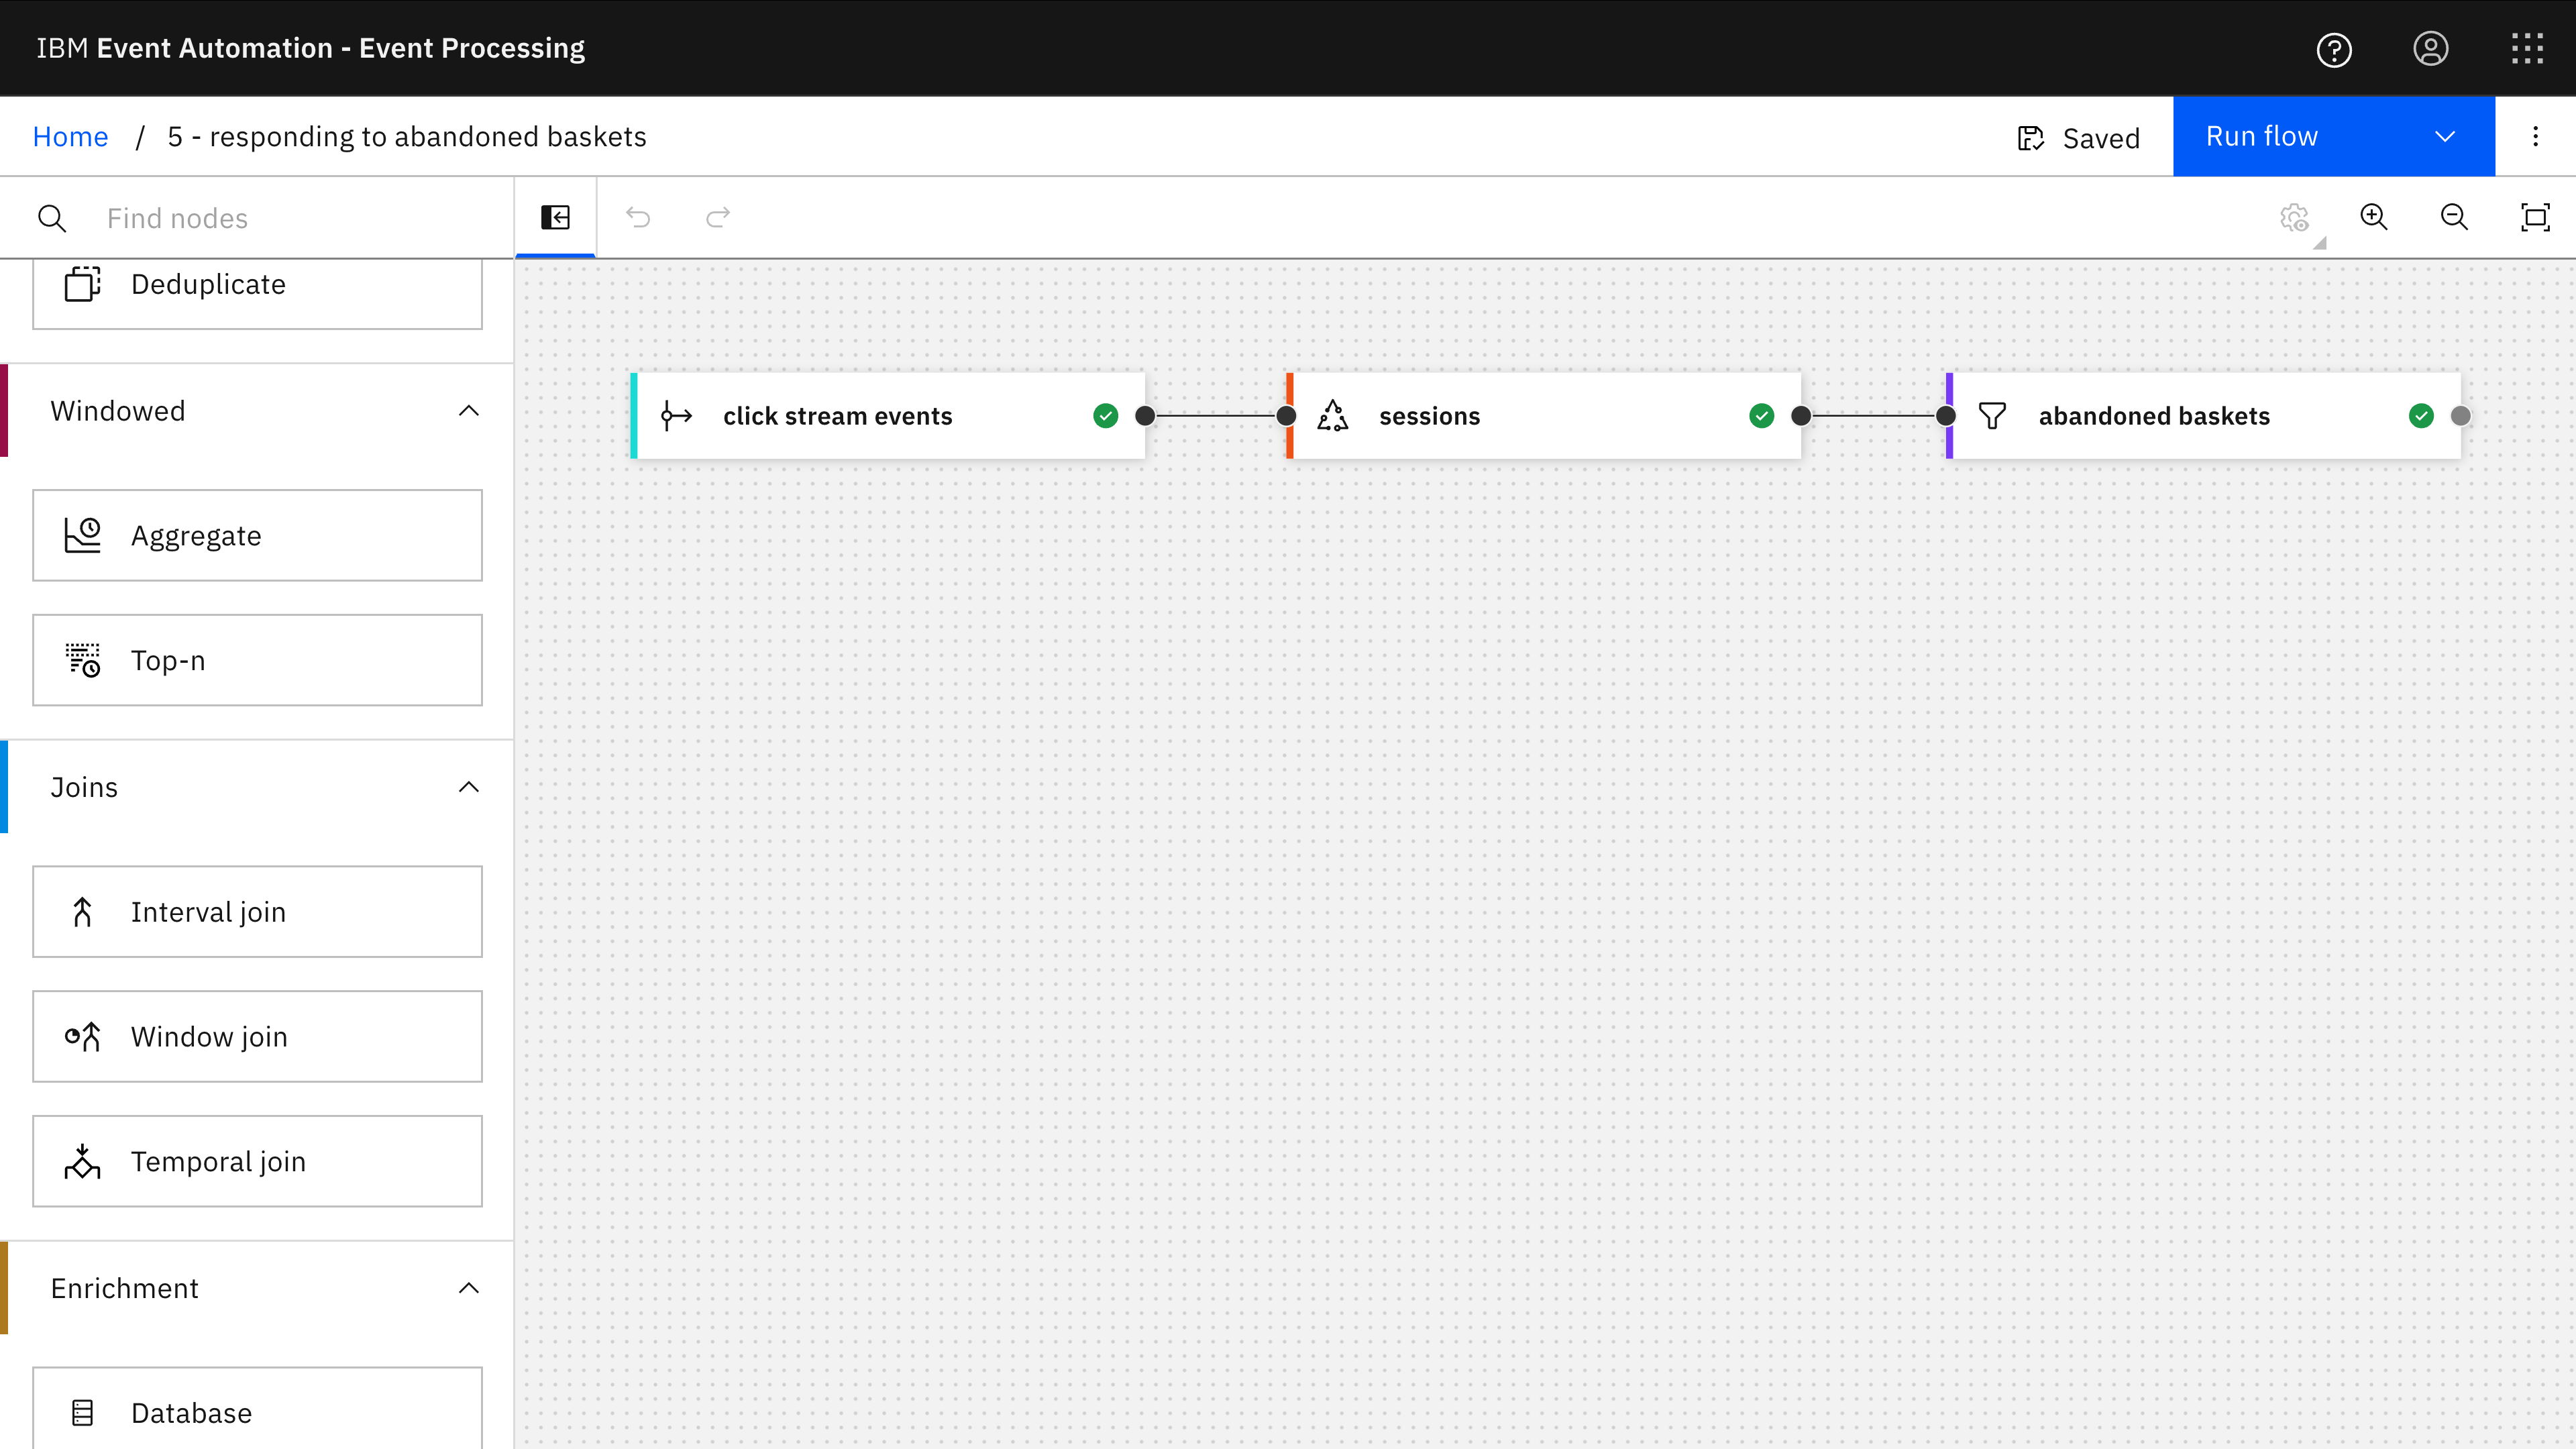
The Event Processing project for this example collects click tracking events with the same sessionid into user sessions, and identifies attributes of that session – such as the number of products added to the shopping cart during the session, and whether or not checkout events were included within the session. It then adds a filter node so that only sessions with an abandoned basket are kept.
The SQL to define the session in this example is at 5-aggregate-session.sql in lines 72-125.
The session window let me collect together all individual click tracking events that have the same sessionid value – that are all part of the same overall user session. This aggregate SQL demonstrates a few of the functions that can be applied to the events in each session:
TIMESTAMPDIFF– to compute the duration of the sessionARRAY_AGG– to collect a list of the products added to the shopping basket across multiple separate events within the sessionARRAY_EXCEPT– to remove products that were removed from the shopping basket from that collected listMAXandCASE– to identify whether a checkout-complete event was contained in the session
The result from this is that every time a session discontinues (which I’ve defined as no events with that session id being received for 15 minutes) an event is emitted with details from that user session, such as how long the session lasted, the customer id, the contents of their shopping basket at the end of the session, and whether or not they made a purchase.
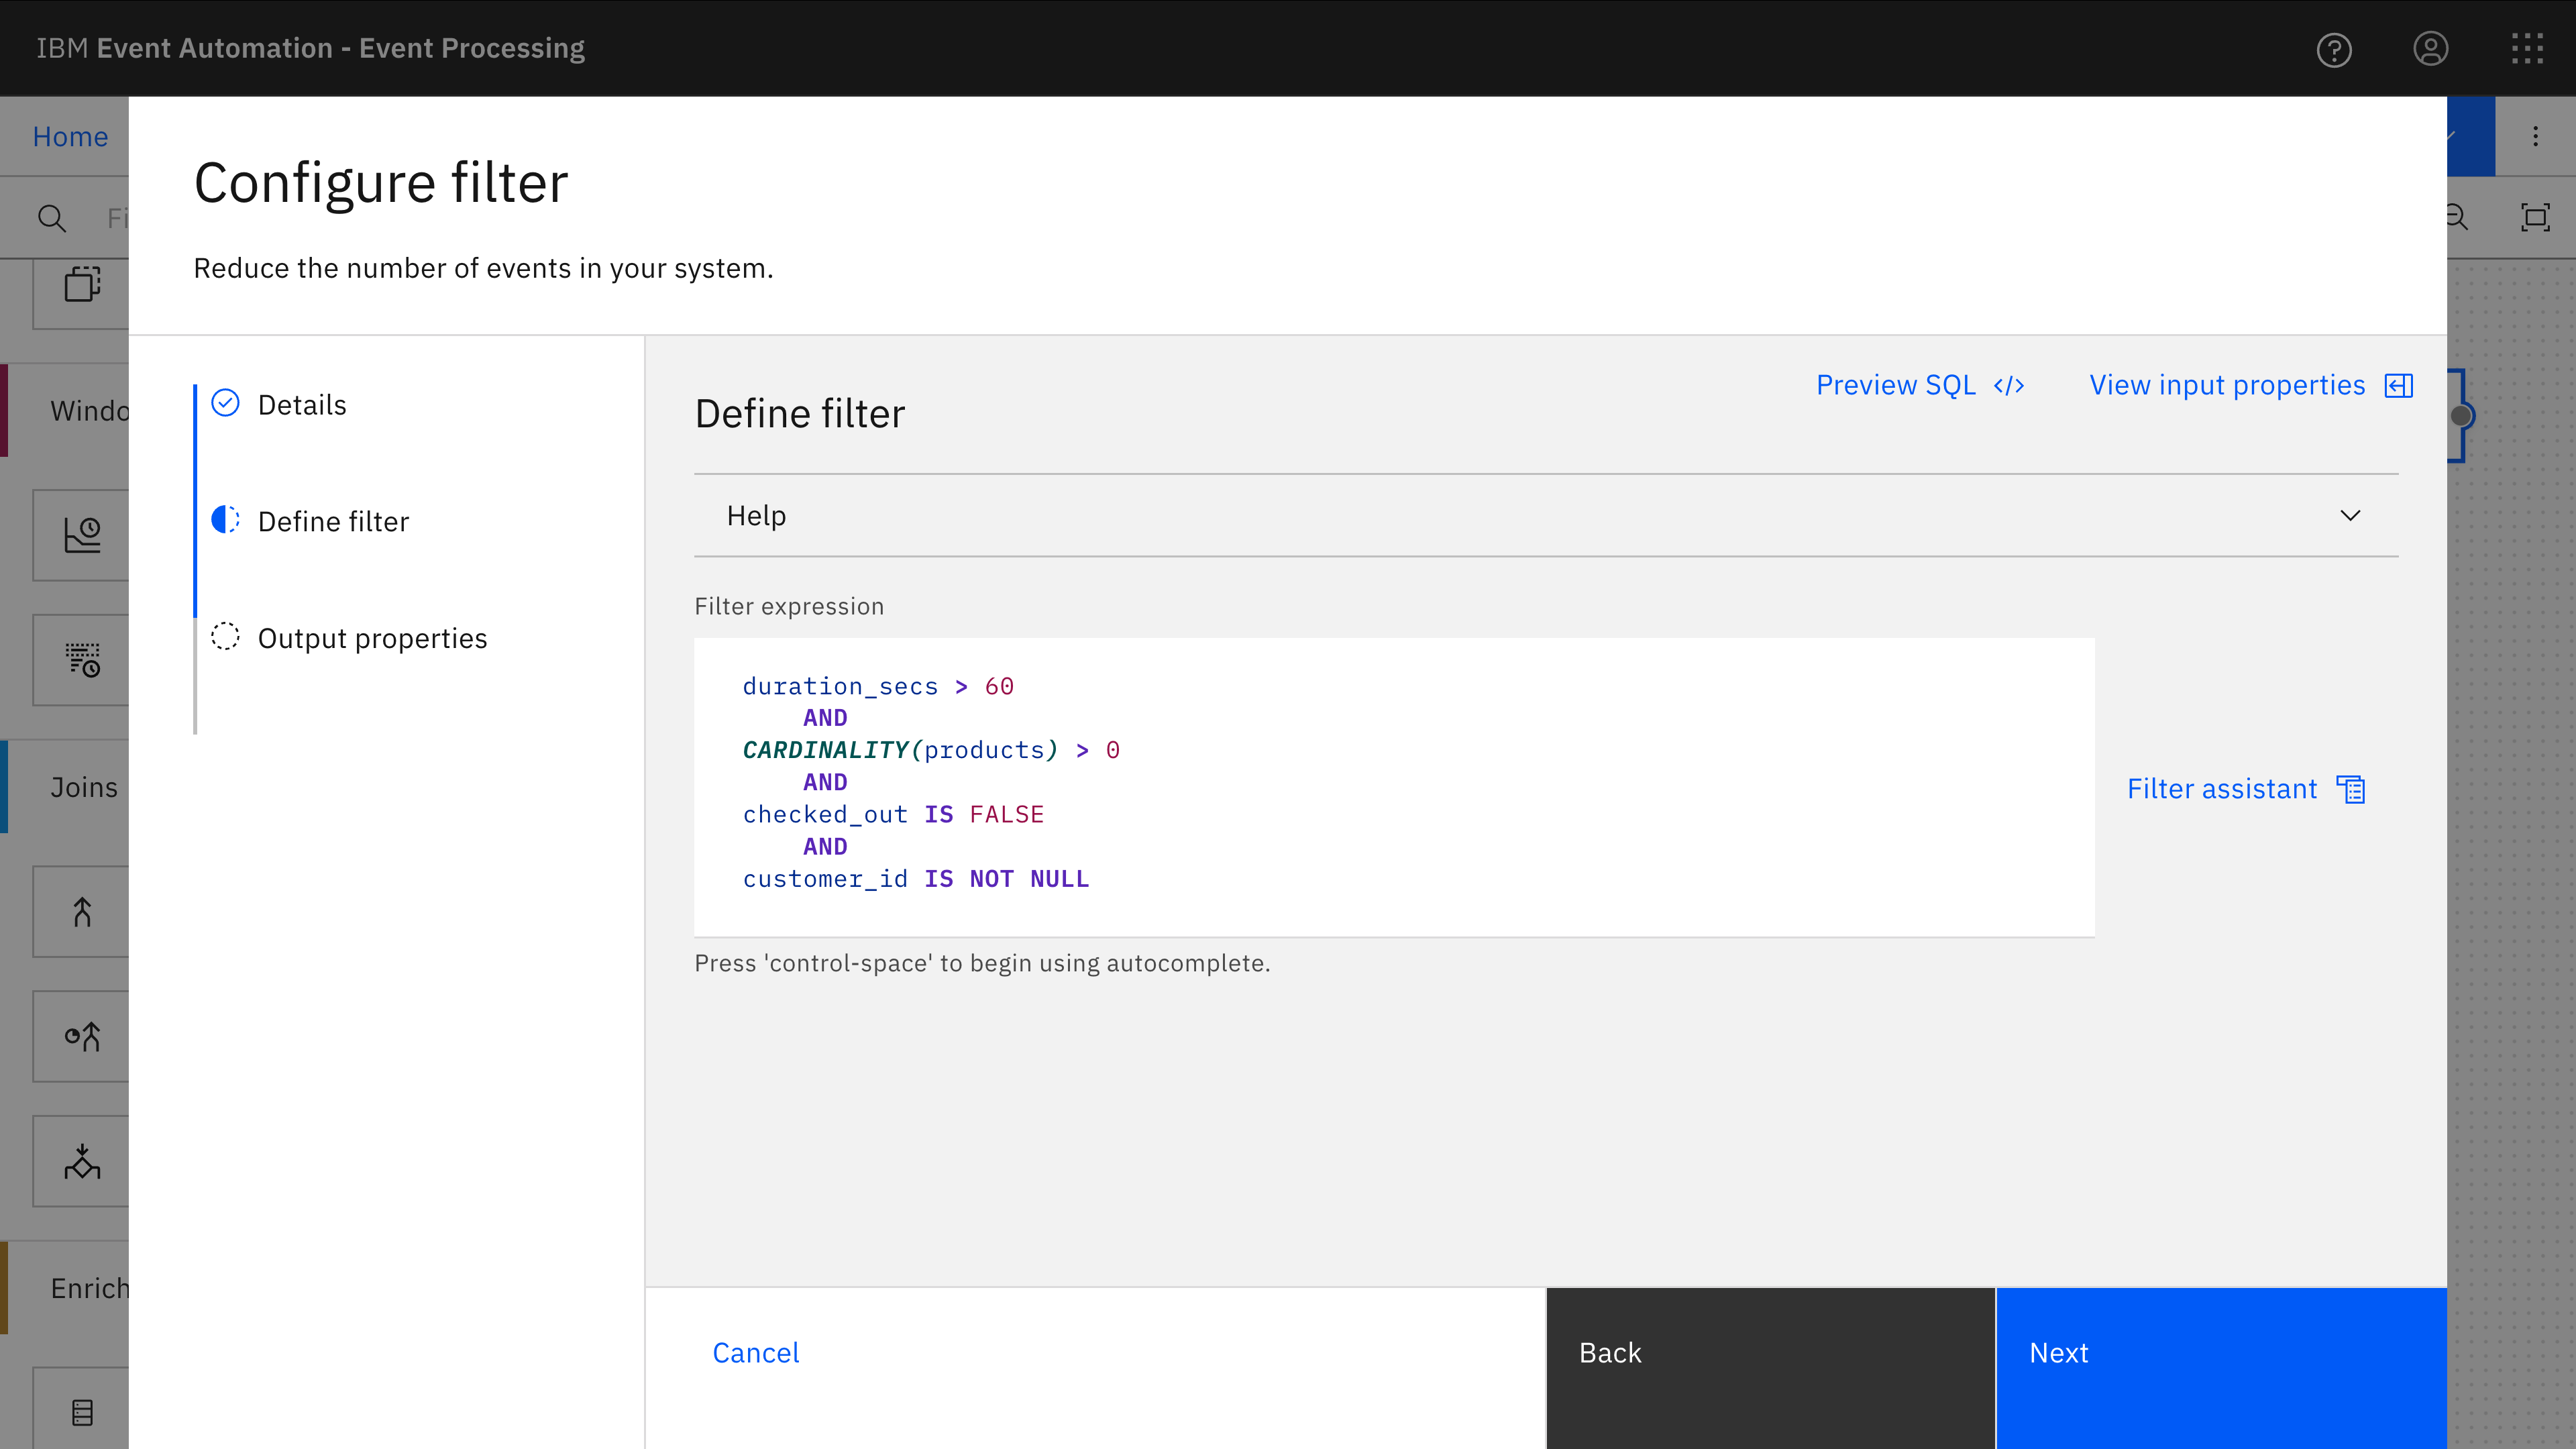
These session properties can be used in a filter to just keep events from the end of a session that resulted in an abandoned basket:
- duration of at least 60 seconds – to ignore users who clicked away very quickly
- at least one product in their shopping basket
- no checkout complete event
- logged in user
The SQL to do this is at 5-aggregate-session.sql in lines 143-161.
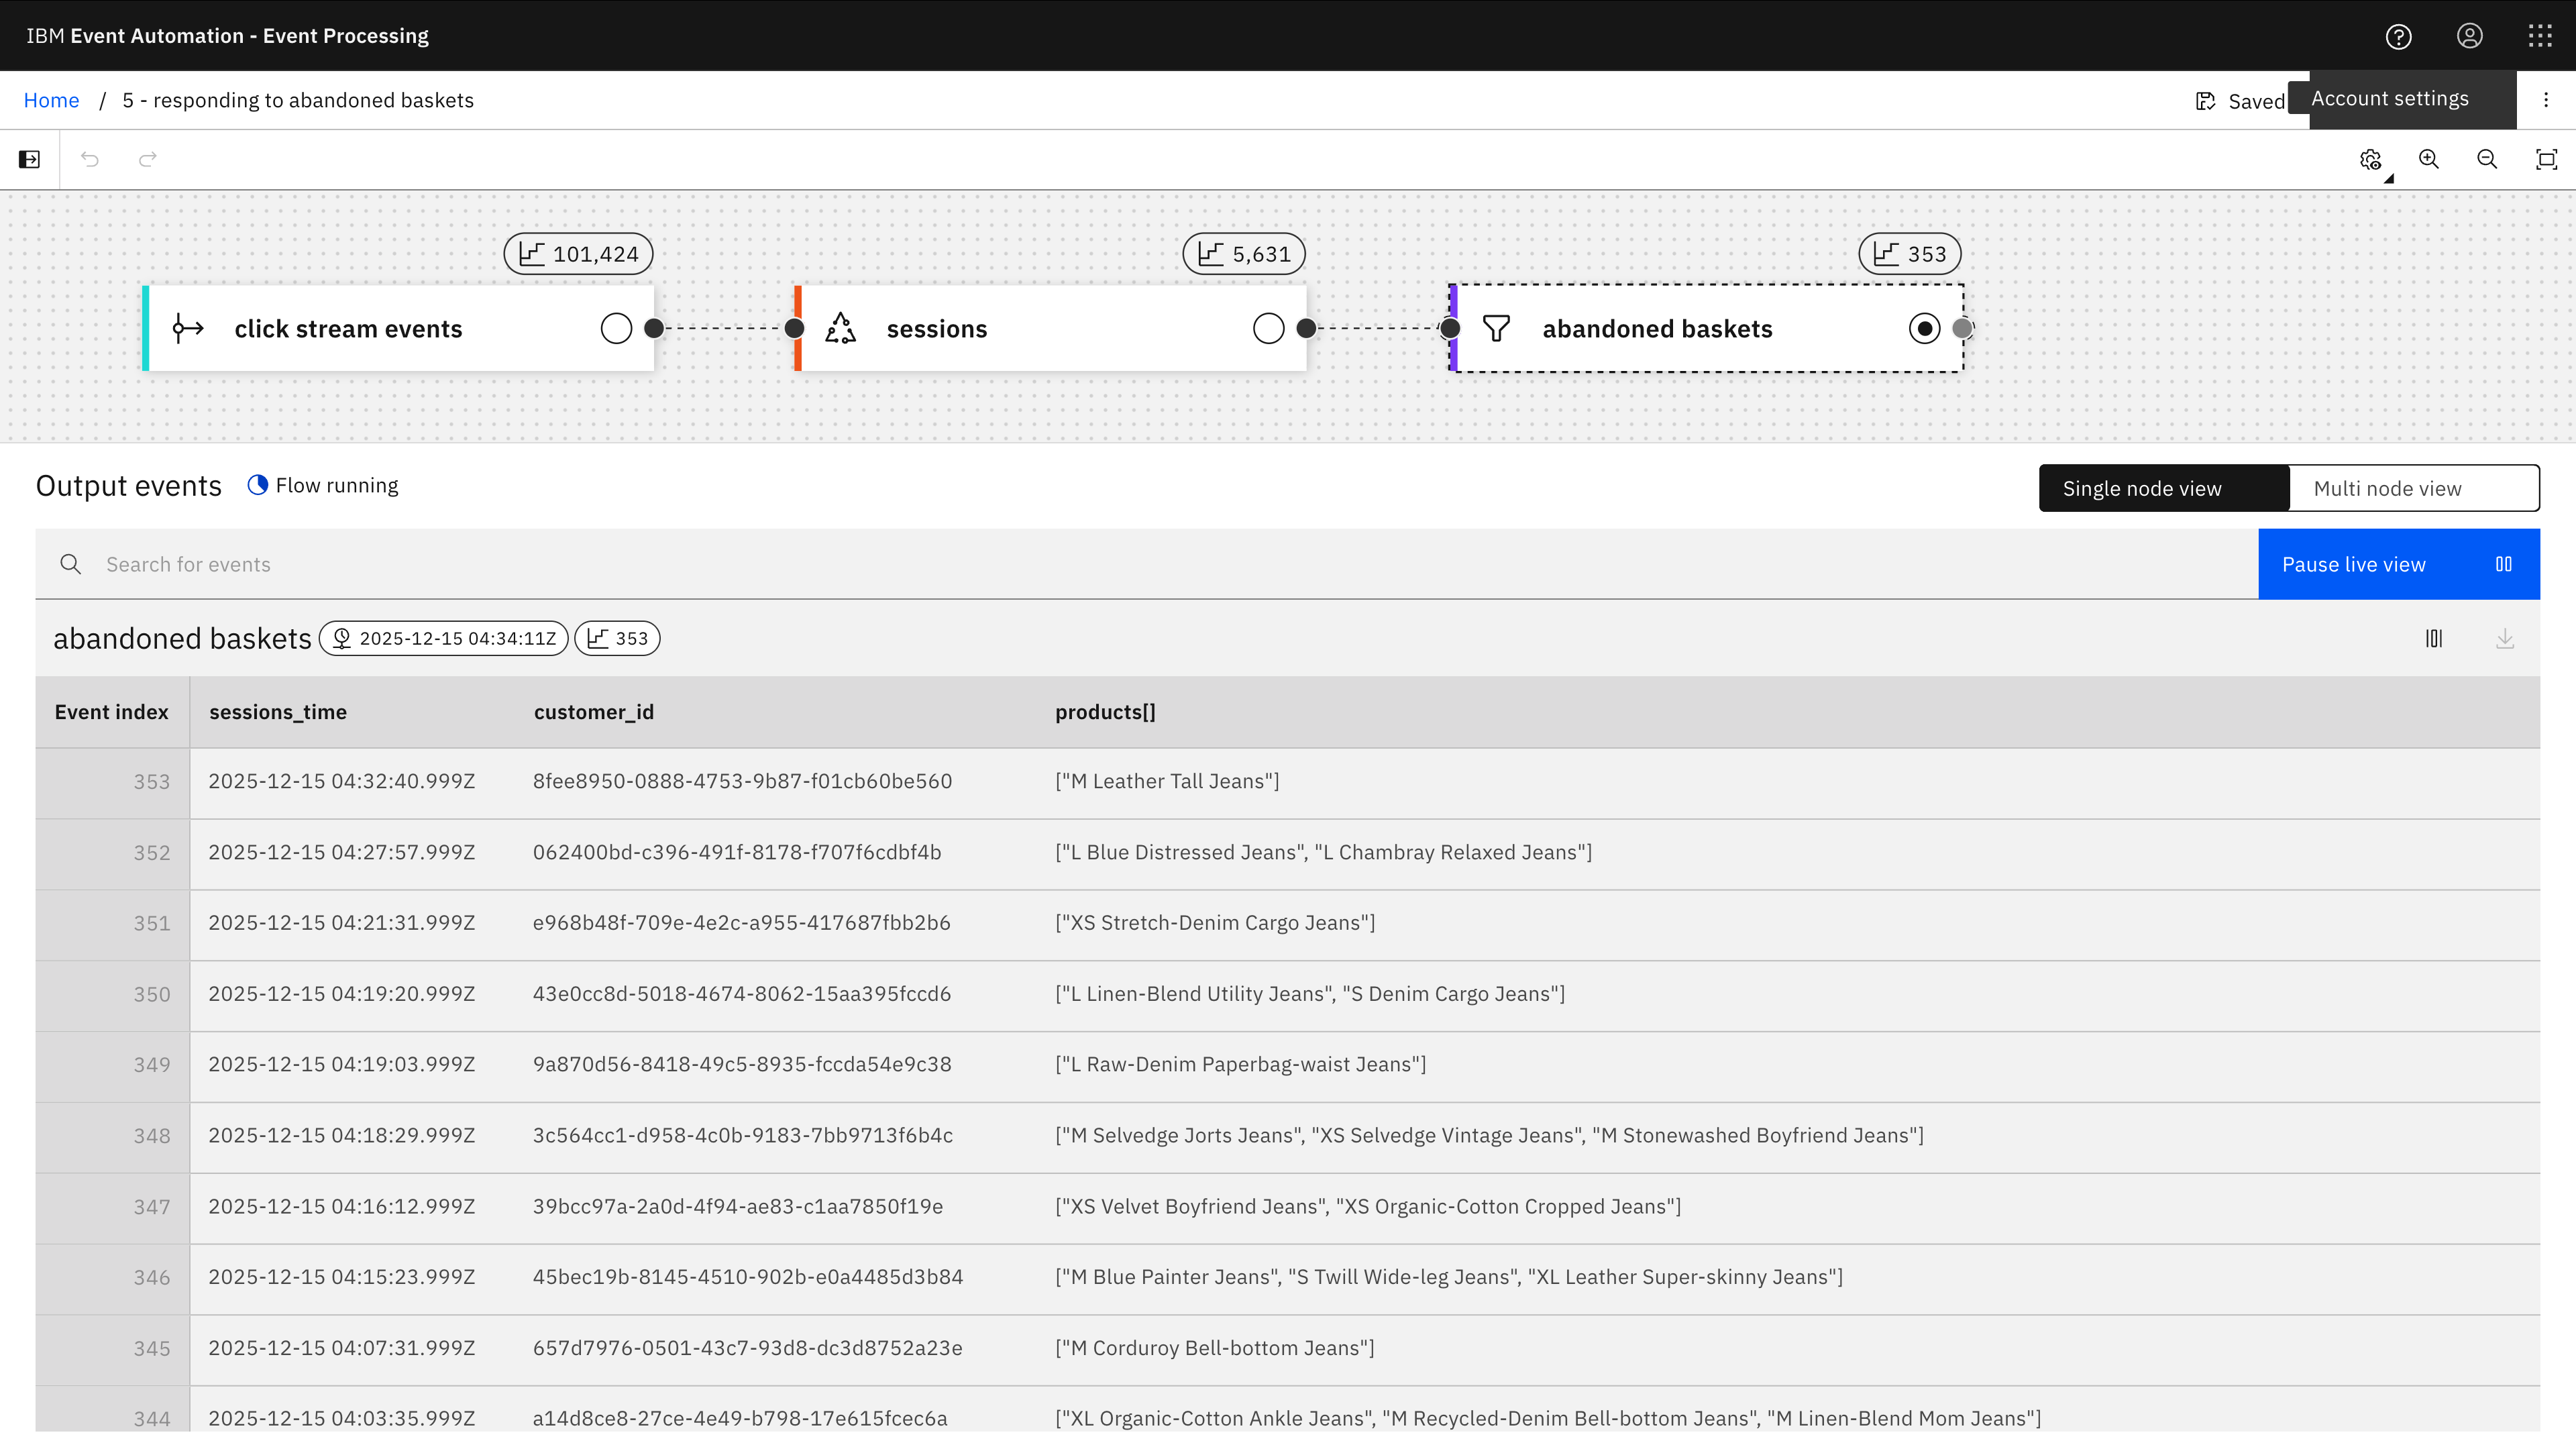
The result from this is that when a logged in user abandons their session (which I’ve defined as no click events observed for 15 minutes), an event is emitted with their customer id and the contents of their shopping basket.
This could be used to trigger some automated promotional activity for that customer.
6 Buying behaviour
Demonstrating how to recognize sequences of events that match a defined pattern to identify different shopper behaviours in a stream of click tracking events.
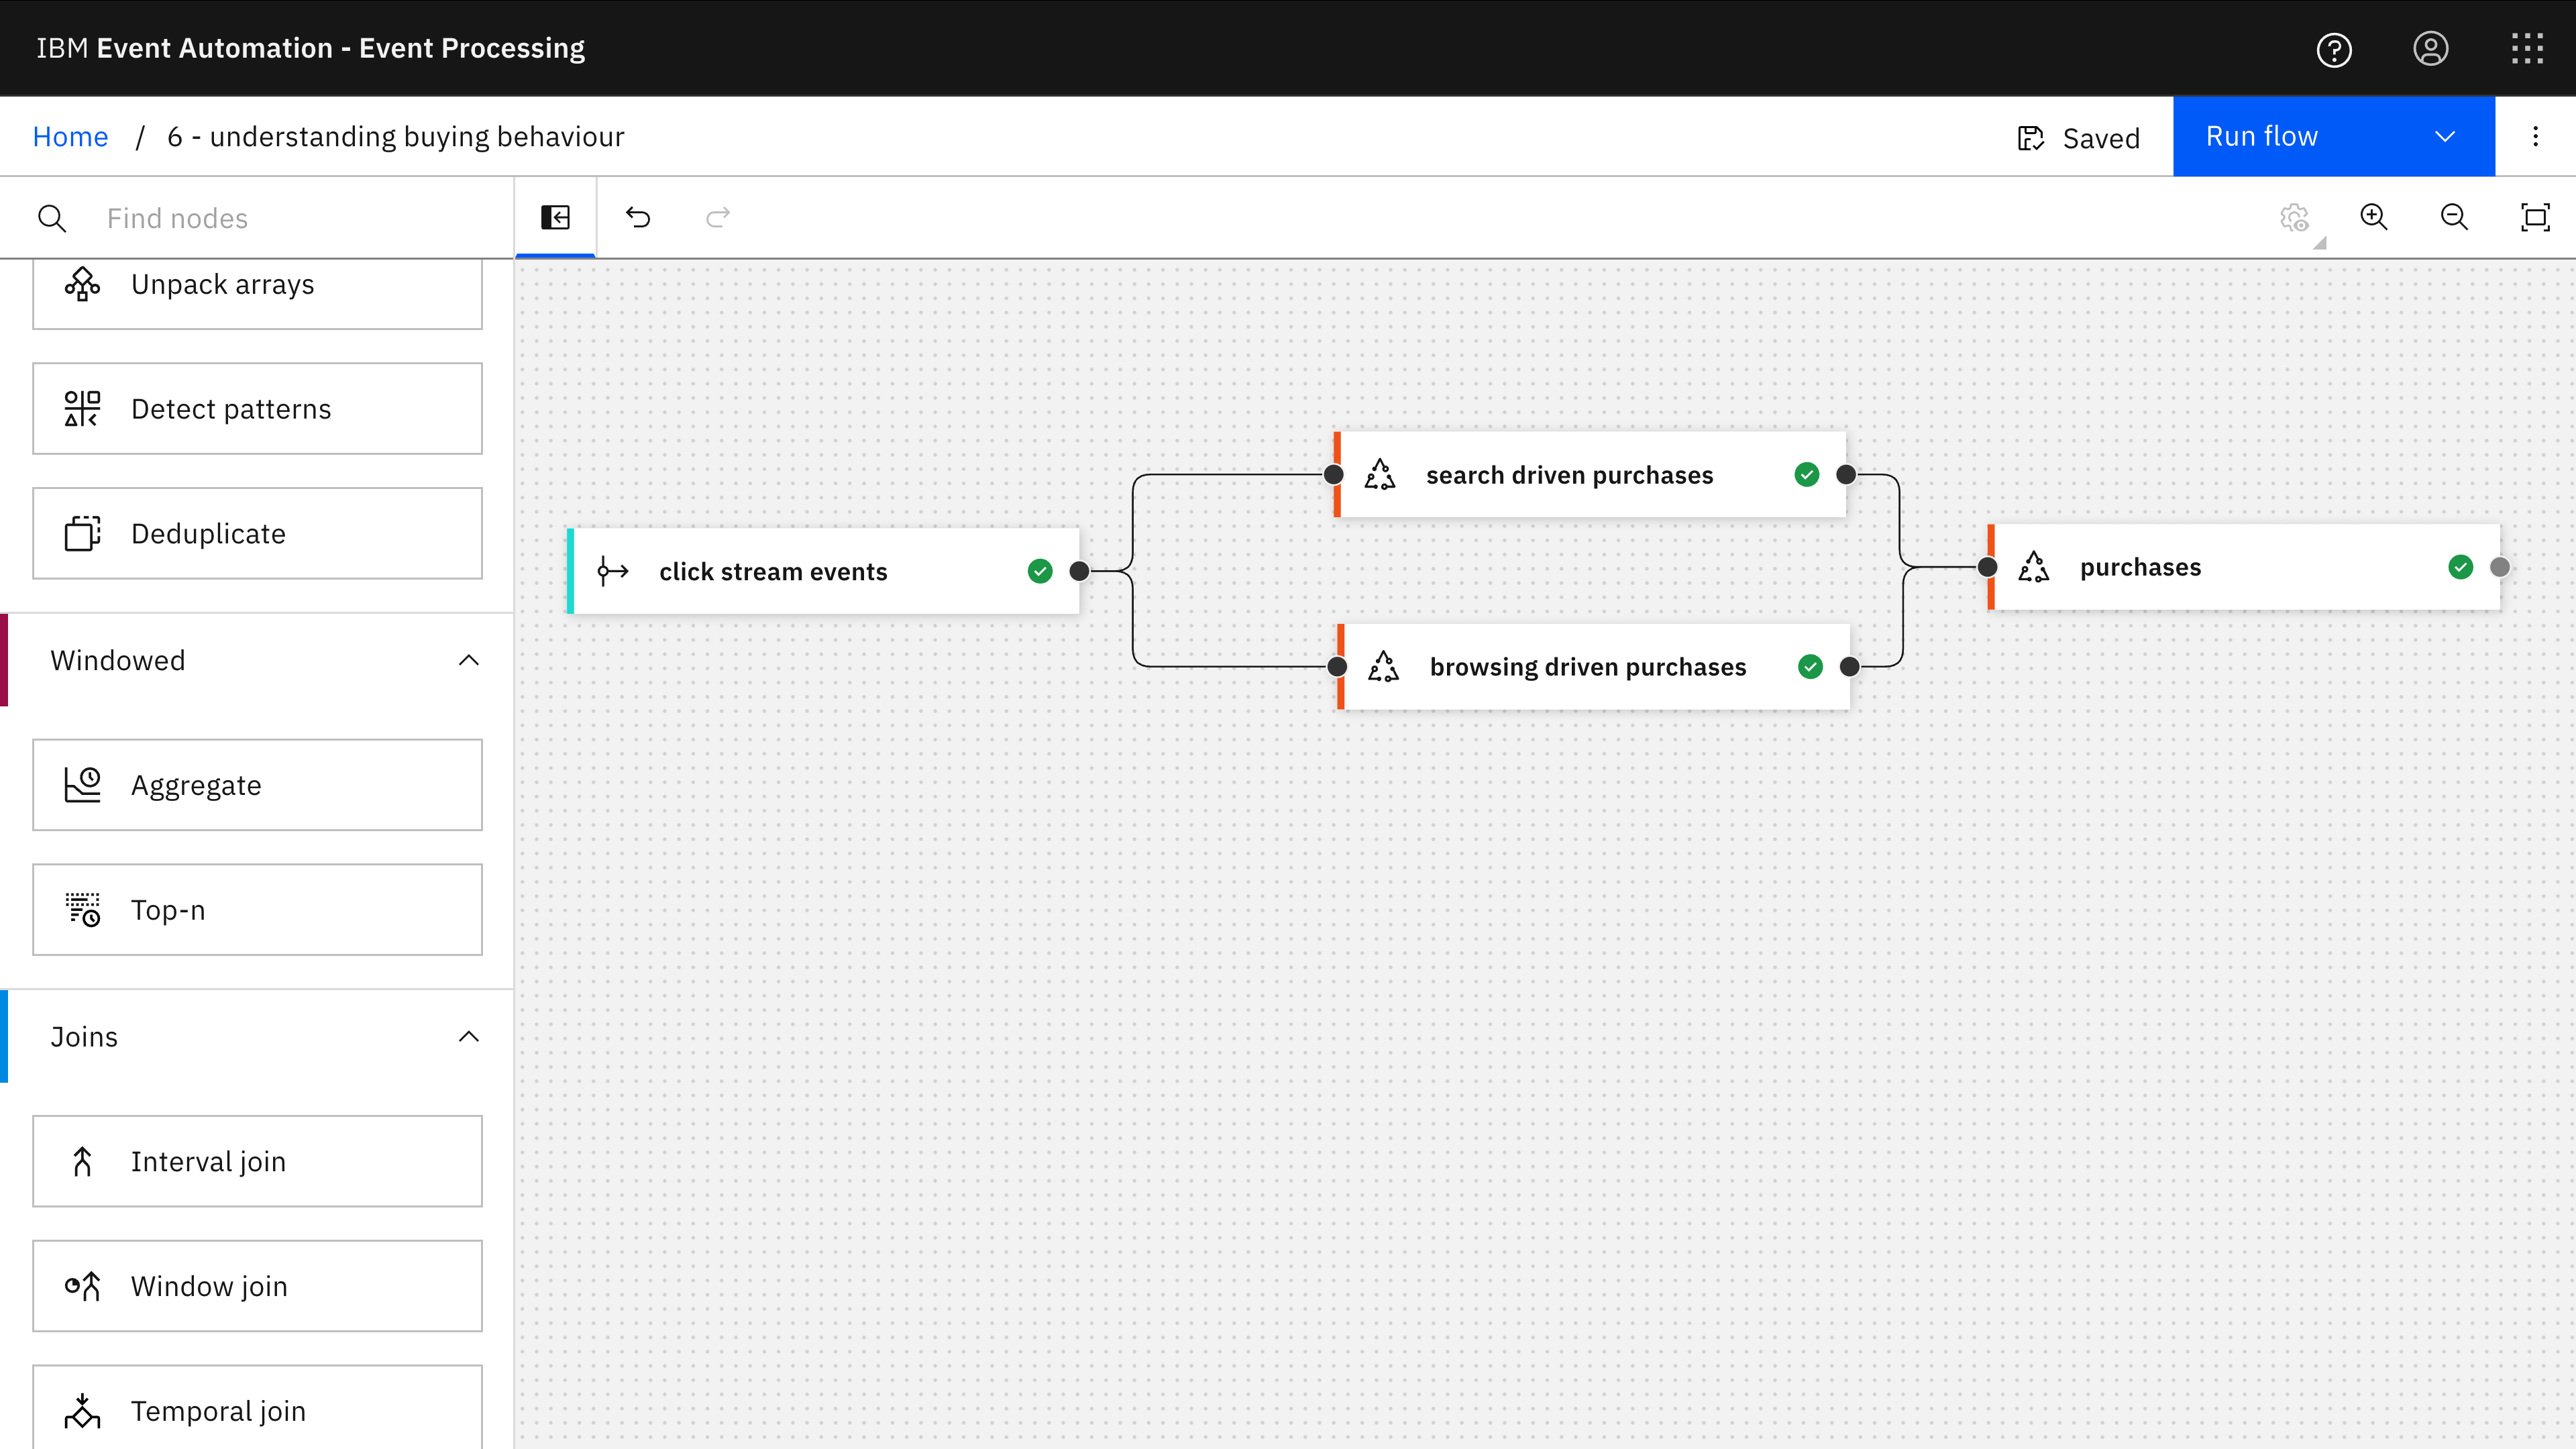
The Event Processing project for this example contains two different pattern detection nodes:
- looking for a sequence of click tracking events that indicates a customer making a purchase following searching for specific items
- looking for a sequence of click tracking events that indicates a customer making a purchase following browsing lists of products within a category
These are then combined into a single stream of purchase events, enriched with a label that describes the type of behaviour suggested by the click tracking events that led to the purchase.
The SQL to recognise searching behaviour is at 6-match-recognize.sql in lines 96-128.
The simplified sequence I’ve defined is a search, followed by adding something to the shopping basket, followed by completing a purchase.
The SQL to recognize browsing behaviour is at 6-match-recognize.sql in lines 162-194.
The simplified sequence I’ve defined is a browse, followed by adding something to the shopping basket, followed by completing a purchase.
More complex and advanced patterns can be implemented – these are simple examples to illustrate what is possible.
The results from each of these are then combined together using a UNION on line 206.
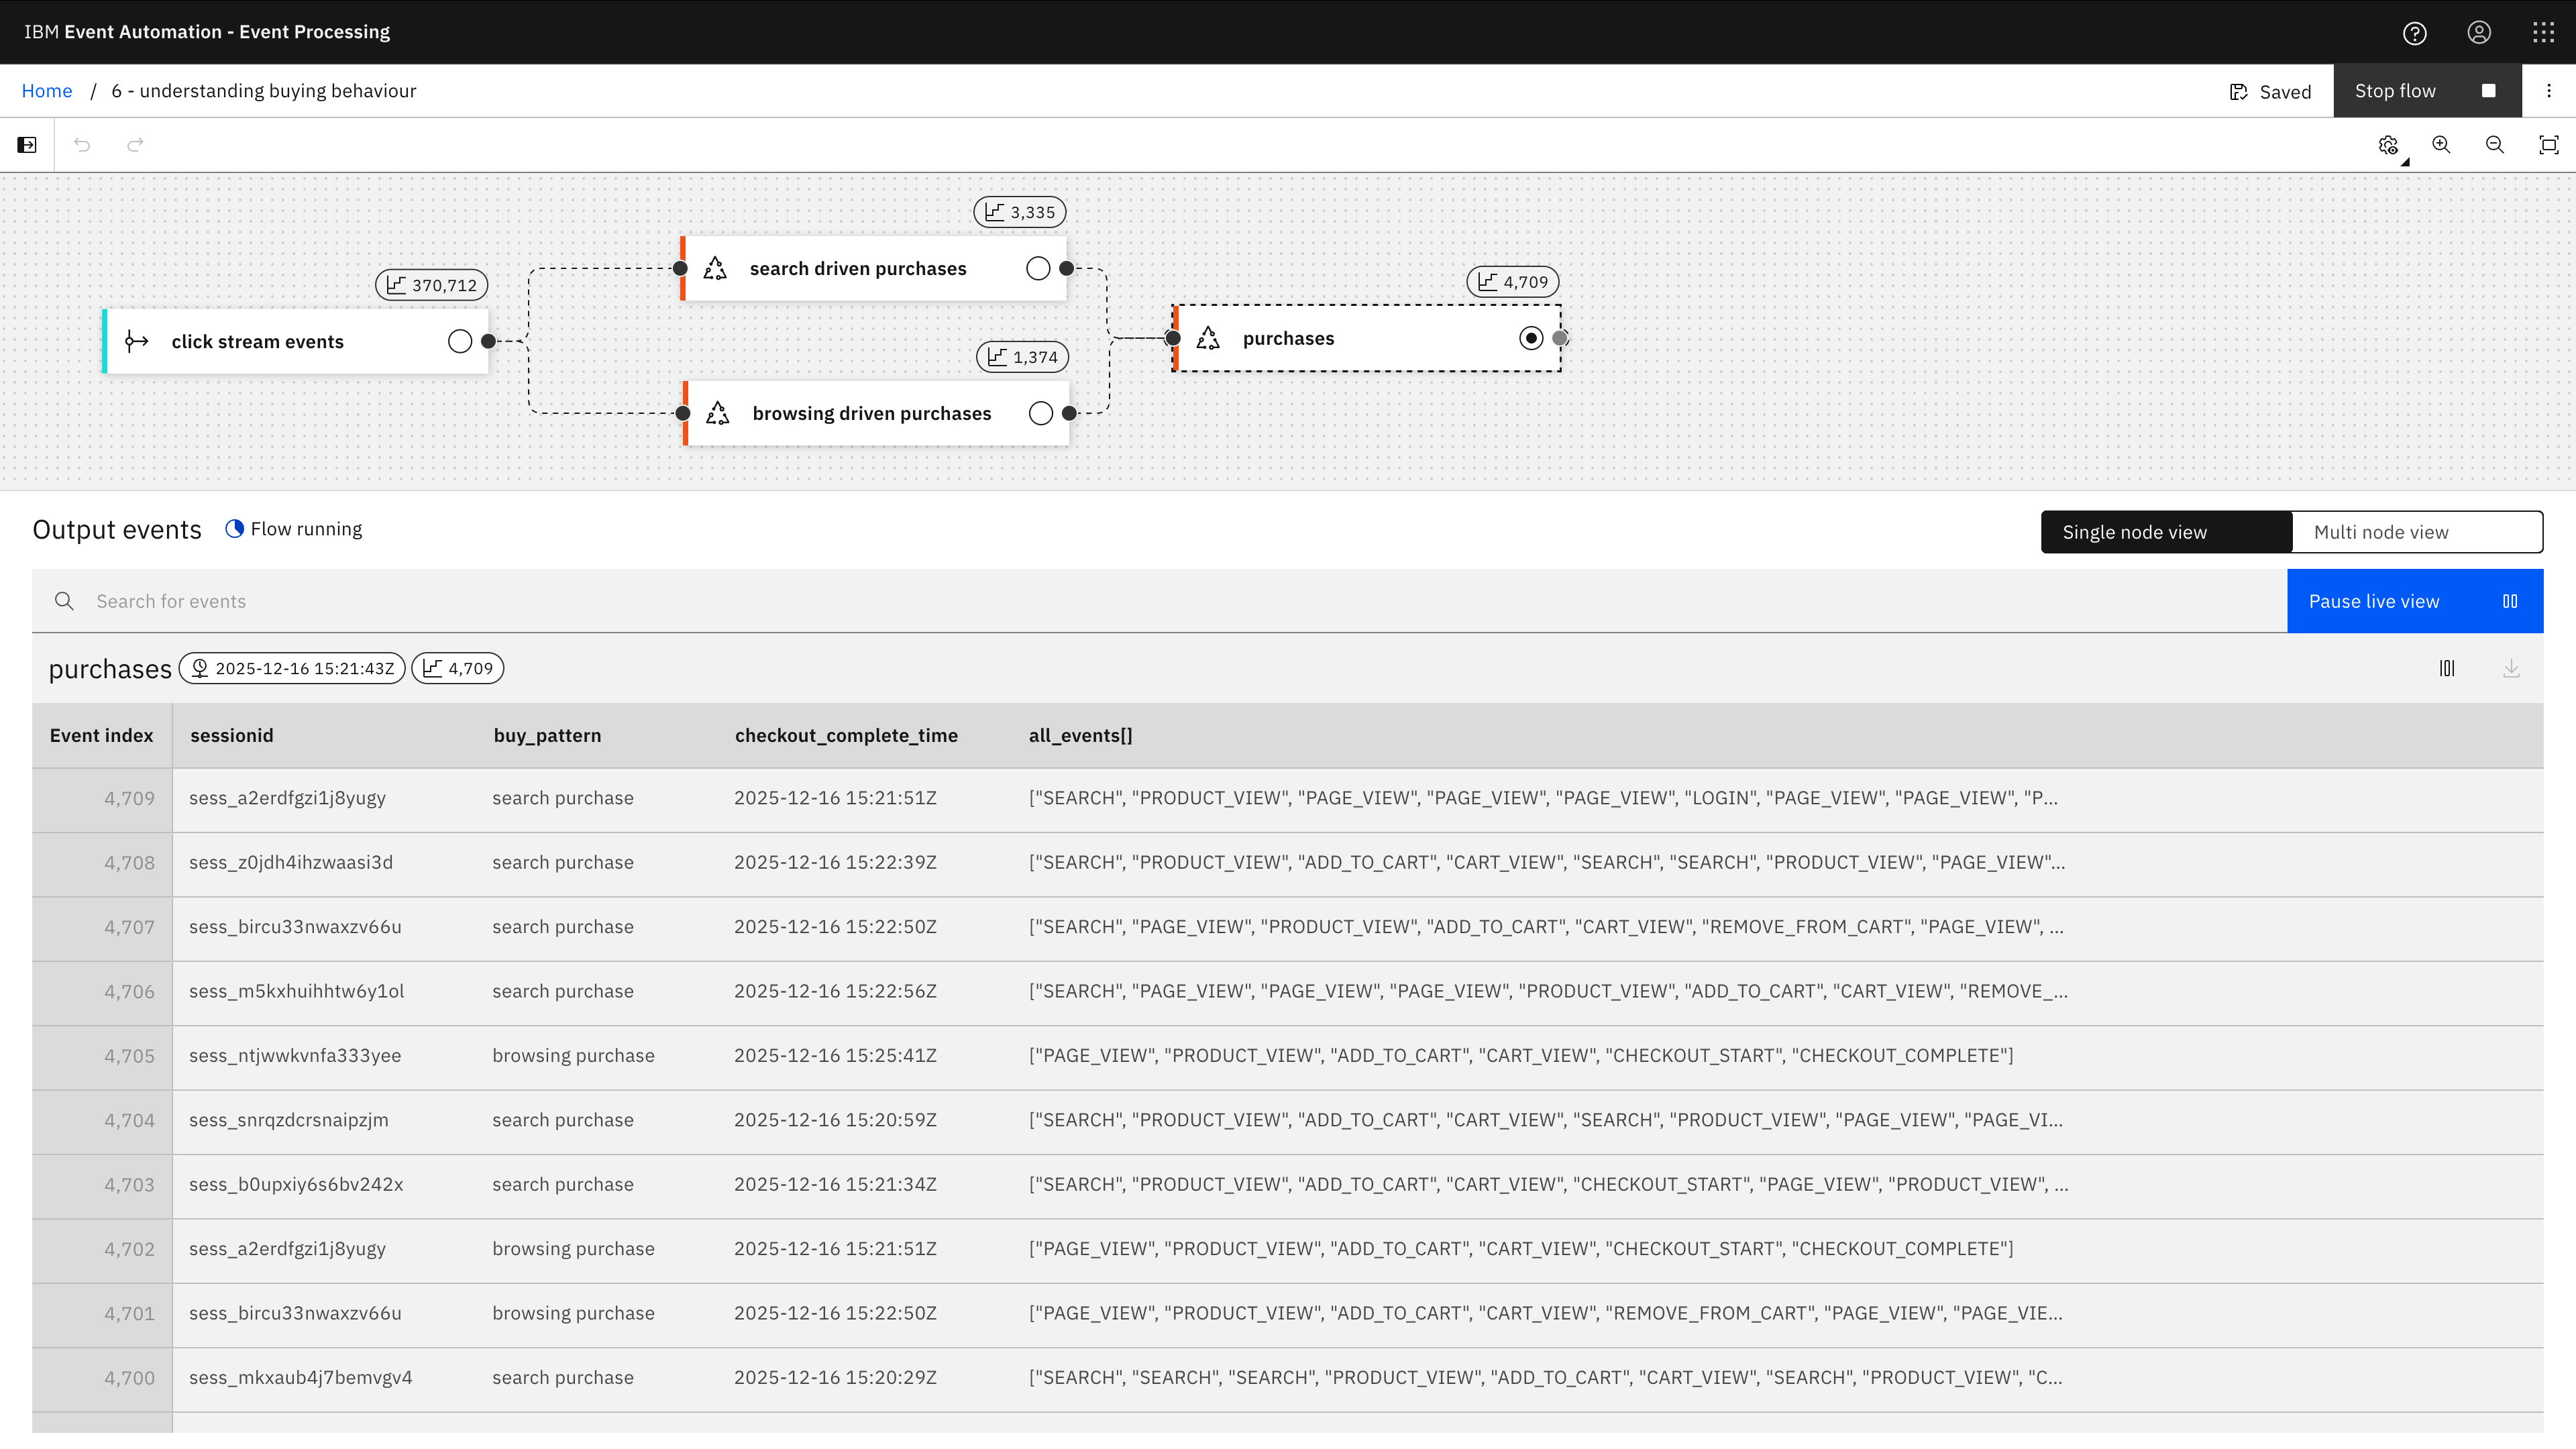
The result is a stream of purchase events, enriched with a label that describes the type of behaviour suggested by the click tracking events that led to the purchase.
The data
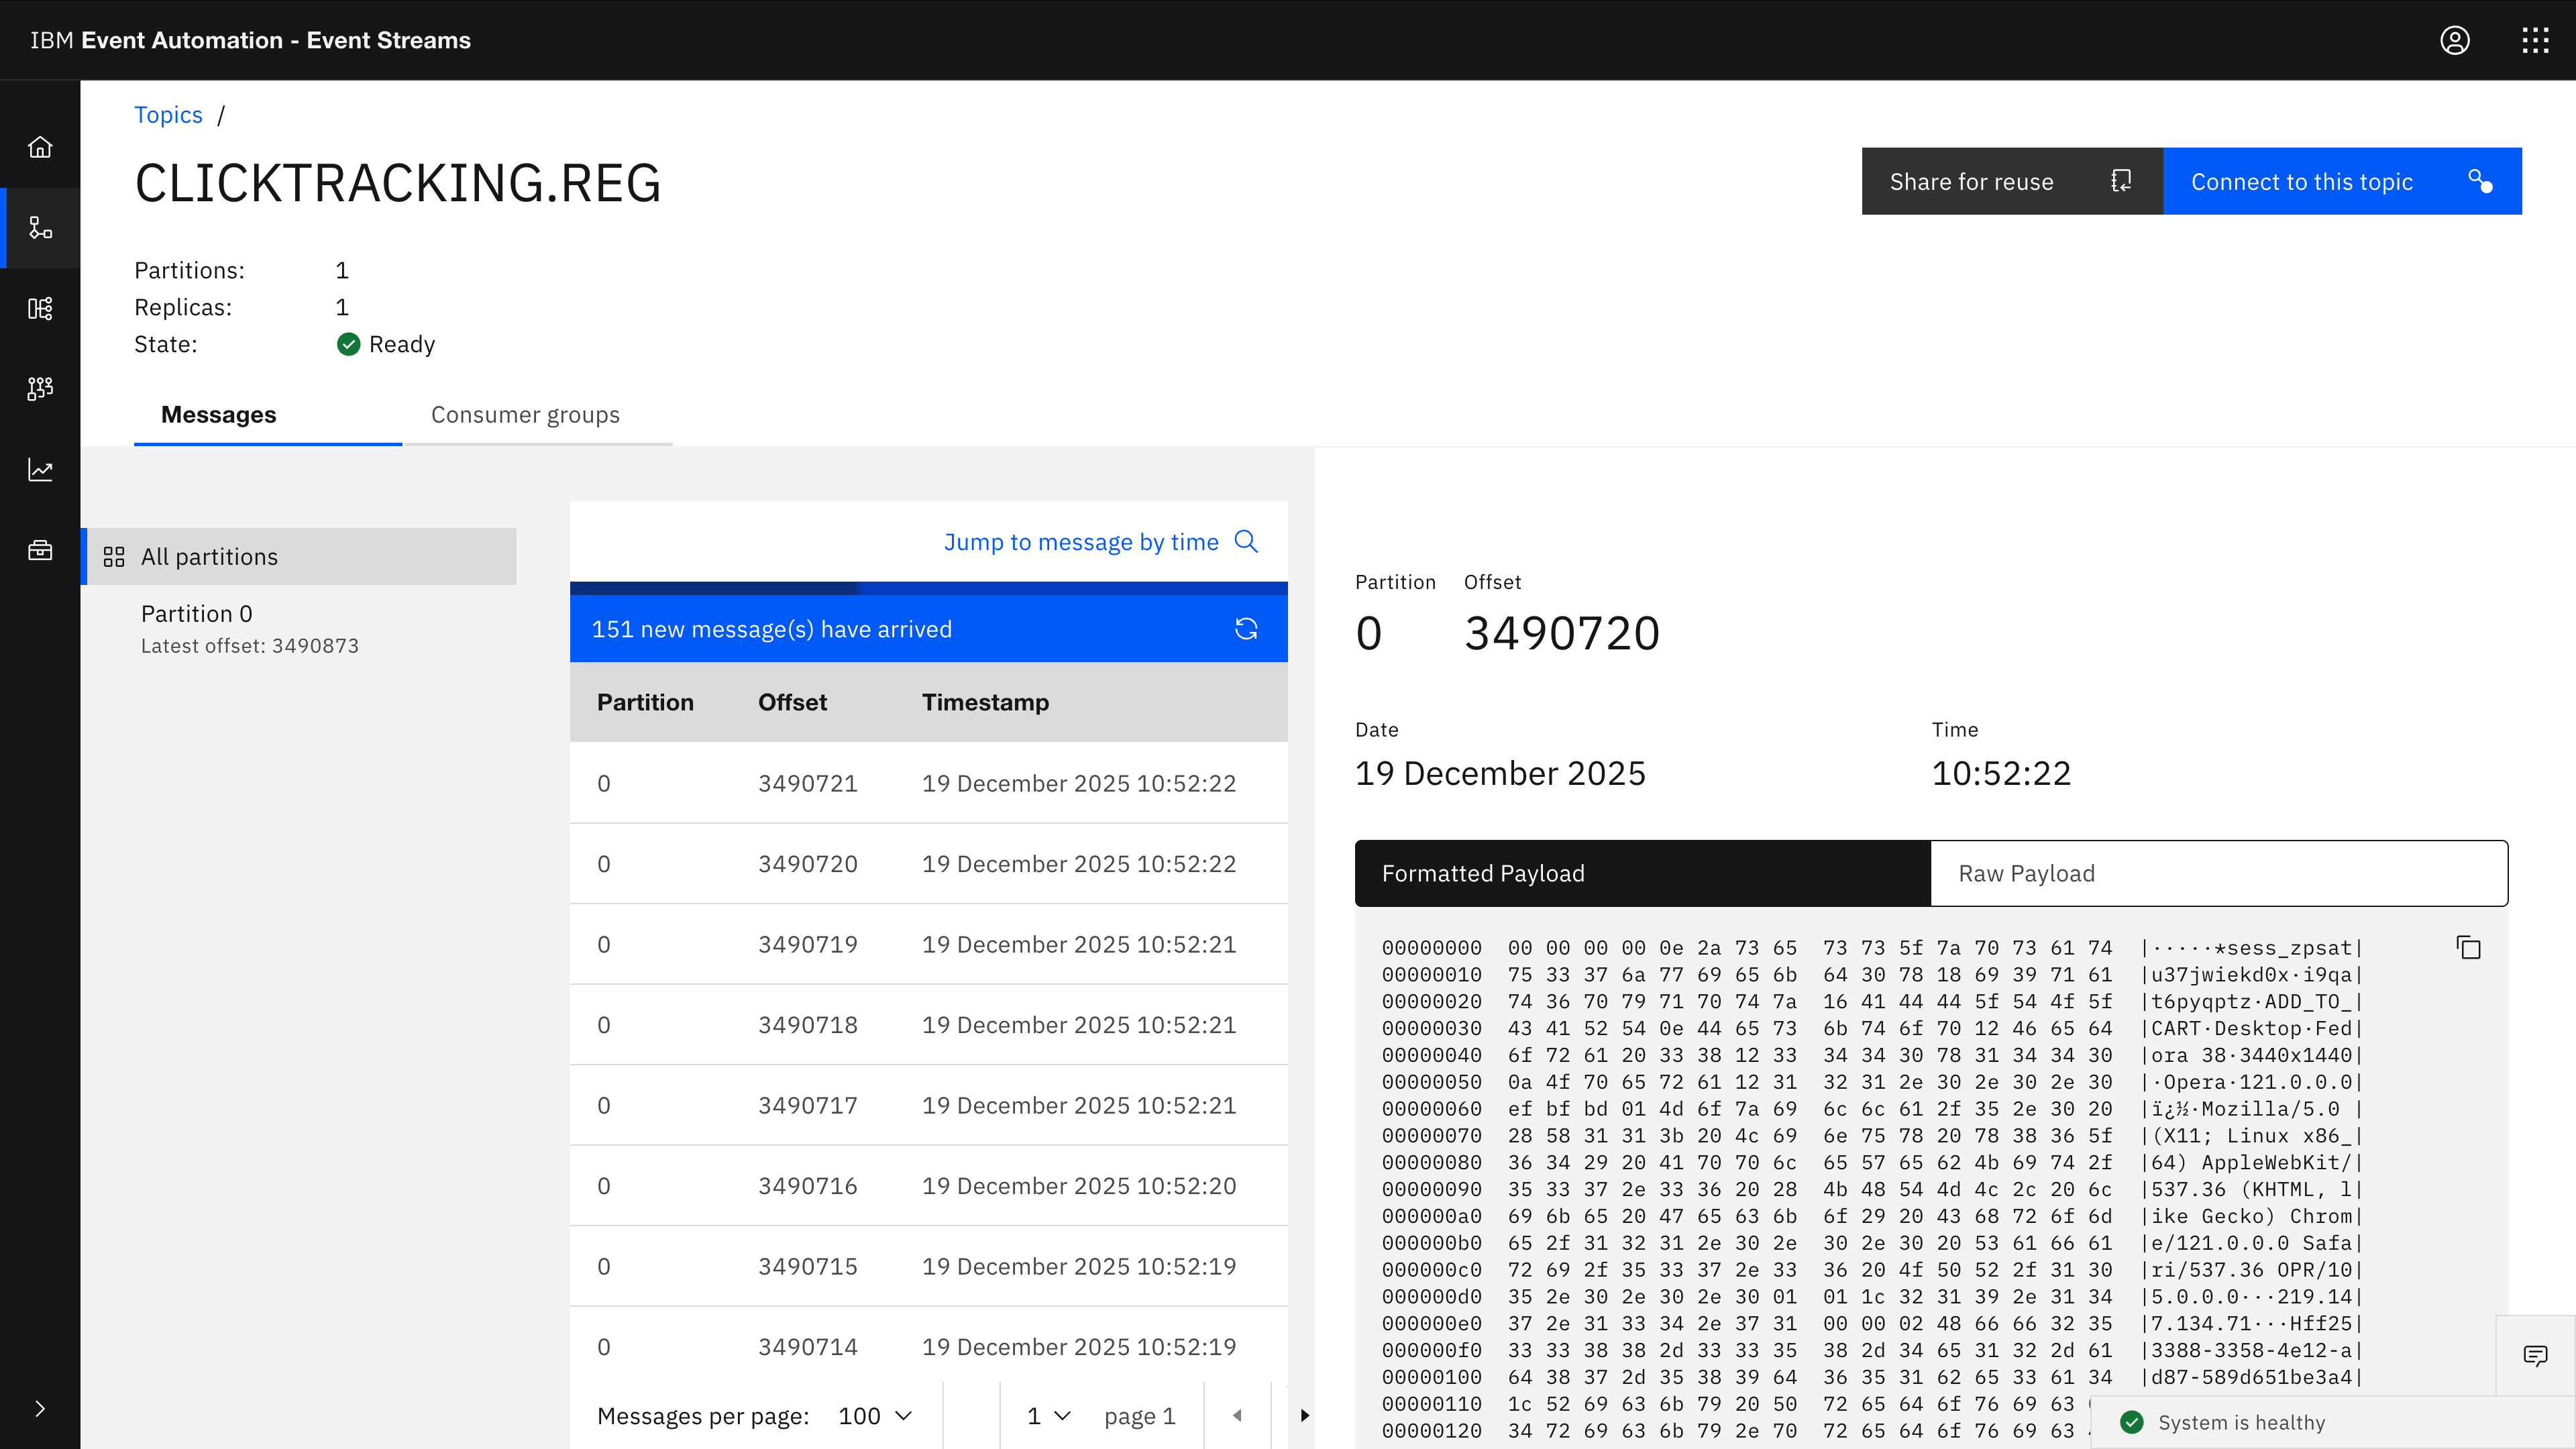
I’m processing Avro-encoded events in these examples, so looking at the raw data as in this screenshot isn’t super helpful.
If you’re familiar with Avro, you can look at the Avro schema for the click tracking events, which includes a description of each of the fields.
To make it easier to understand, I ran kafka-console-consumer on the topic using an Avro formatter with jq to prepare these more readable JSON representations.
kafka-console-consumer.sh \
  --bootstrap-server  my-kafka-cluster-bootstrap-event-automation.apps.dale-lane.cp.fyre.ibm.com:443 \
  --topic             CLICKTRACKING.REG \
  --consumer.config   es.properties \
  --formatter         com.ibm.eventautomation.kafka.formatters.ApicurioFormatter \
  --formatter-config  es-formatter.properties
This isn’t an exhaustive list of what sorts of events are possible (look at the schema to understand that) but rather a few illustrative examples to understand the sort of events I’ve been processing.
Page views
Someone has viewed a page on the Loosehanger Jeans website.
The event includes information about what page they viewed, and what device they’re using to view it. If the user is logged in, user details will be included. If they’re not logged in, customer will be null. If they came to the Loosehanger Jeans website from somewhere else, the referrer URL will be included.
Pages can contain a list of products (e.g. products in a category, search results, etc.) or be static content (e.g. company information). Pages for an individual product are identified with a different PRODUCT_TYPE event.
sample page view event 1-page-view.json
Search
Someone has searched for a product on the Loosehanger Jeans website.
If the user is logged in, user details will be included. If they’re not logged in, customer will be null. The event includes information about the device that the user is using.
sample search event 2-search.json
Add to shopping cart
Someone has added a product to their shopping basket.
The event includes a description of the product the user has added. Users do not need to be logged in to do this, they can log in at the point they are ready to check out. The event includes information about the device that the user is using.
sample add to cart event 3-add-to-cart.json
Remove from shopping cart
Someone has removed a product from their shopping basket.
The event includes a description of the product the user removed. Users do not need to be logged in to do this, they can log in at the point they are ready to check out. The event includes information about the device that the user is using.
sample remove from cart event 4-remove-from-cart.json
Login
A registered user has logged into the Loosehanger Jeans website.
The event includes details about the user who has logged in, and the device that the user is using.
sample login event 5-login.json
Checkout
A registered user has completed a purchase on the Loosehanger Jeans website. There are a series of events that occur when someone makes a purchase (e.g. CART_VIEW, CHECKOUT_START) but CHECKOUT_COMPLETE is the interesting one that is emitted when a purchase is complete.
sample checkout event 6-checkout.json
Others
There are other events, but those are enough to give you the idea of the sort of thing that we’ve got to play with.
Setup
My goal with this post was to inspire – when introducing teams to Flink, I find that it helps to have tangible concrete examples of what it can be used for, and how to turn ideas into Flink SQL.
If you’d like to try these examples for yourself, you can follow these setup instructions. In summary, I’m using the “Loosehanger Jeans” data generator, which is a configurable Kafka Connect source connector that generates sythentic events for demo and development projects.
I’m using it to produce Avro-encoded events using a Confluent-compatible schema registry.
data generator config that I used
I used Avro as I wanted to demonstrate the way to integrate with a schema registry, but you could simplify this by generating JSON events and then changing the Flink connector format to json. In that way, you could even run all of it using OSS Kafka and Flink on your own laptop.
Tags: flink