Metrics can help provide operational insight over Kafka Connect connectors, informing users of how to better configure them. With simple updates, a Kafka Connect connector can be instrumented to make this possible by emitting useful metrics.
A couple years ago, I created a simple skeleton Connect connector project to help developers at a hackathon create their first Kafka connector.
I’ve updated the source connector from that sample to emit metrics. In this post, I’ll walk through what I did, as an example for how to add metrics to your own Kafka connector.
To add some context that might help when I go through what metrics I added, this connector periodically polled a weather API for weather reports, and emitted a Kafka event when the weather report details changed.
Check for support
Support for Connector metrics is a relatively recent addition, so if your Connector might be used in Connect runtimes with versions before 4.2, then you need to handle the support not being there.
The simplest way to do this, as recommended in the Kafka Javadoc, is to handle the NoSuchMethodError or NoClassDefFoundError exceptions that will be thrown when this happens, and gate all the metrics setup behind that.
Get access to the metrics for your plugin
Connectors, converters, and transforms are all Connect plugins. Any of these can emit metrics.
The starting point for registering new metrics for your Connector is to get access to the PluginMetrics instance for your connector.
Count how many times your Connector does things
The sample connector polls an API, so the simplest metric was to count how many times it has called the API.
There are a couple steps to doing this:
addSensor– register what you will be recordingaddmetrics to the sensor that you want Connect to compute and emit
I went with a CumulativeCount for this one, but there are many other types to choose from.
Keep access to the sensor, and now every time my source task calls the weather API, I just need to call record() on the sensor.
Provide insight to inform connector config and tuning
This sample Connector is polling a REST API, and ignoring any responses that have already been sent to Kafka. This means it gives the user the job of making a sensible choice about how frequently to poll, but without an easy way to know how to make that choice.
Metrics could help with this. By emitting a count of how many API calls are being made and ignored, the user can see whether they’ve made the right choice.
Lots of Connectors have a similar requirement to this – a user configuration option that will effect the Connector’s performance or the impact it has on source systems, but without clear visibility needed to best set that config option.
In this case, it was as simple as preparing a sensor to count ignored API call responses, adding a count metric to it…
…and then calling record() on the sensor every time the Connector ignores an API response.
Compute multiple metrics for one sensor
You don’t have to choose only one type of metric for what you record in a sensor.
For example, I created a sensor that I would use to record any time that the API call failed or returned an error.
I created two metrics for this:
- a rate metric to track the rate of API errors over an hour
- a count metric to track the number of API errors seen so far
I still only need to record an API failure once, but this one event is computed and emitted as two types of metrics.
Recording values in metrics
You don’t have to solely record that something has happened in metrics, you can record values with them, too.
For example, how long do the API calls take? I added System.nanoTime() calls before and after the API poll:
By recording this API response time, I can use metrics to keep track on whether the API behaviour is changing or introducing problems.
I created a sensor for API response times, and registered a few metrics:
- average – average API response time within the time window
- minimum – fastest API response time within the time window
- maximum – slowest API response time within the time window
The only difference in how to record this is to include the response time value in the record calls to the sensor.
Try it out
If you’d like to try this sample out for yourself from scratch:
01-download-kafka.sh– download a recent version of Kafka02-run-kafka.sh– start Kafka running05-build-connectors.sh– build the sample connector08-consume-my-topic.sh– optionally, start consuming from the topic to see the weather reports as they arrive- get an API key from weatherapi.com and add it to the connector config
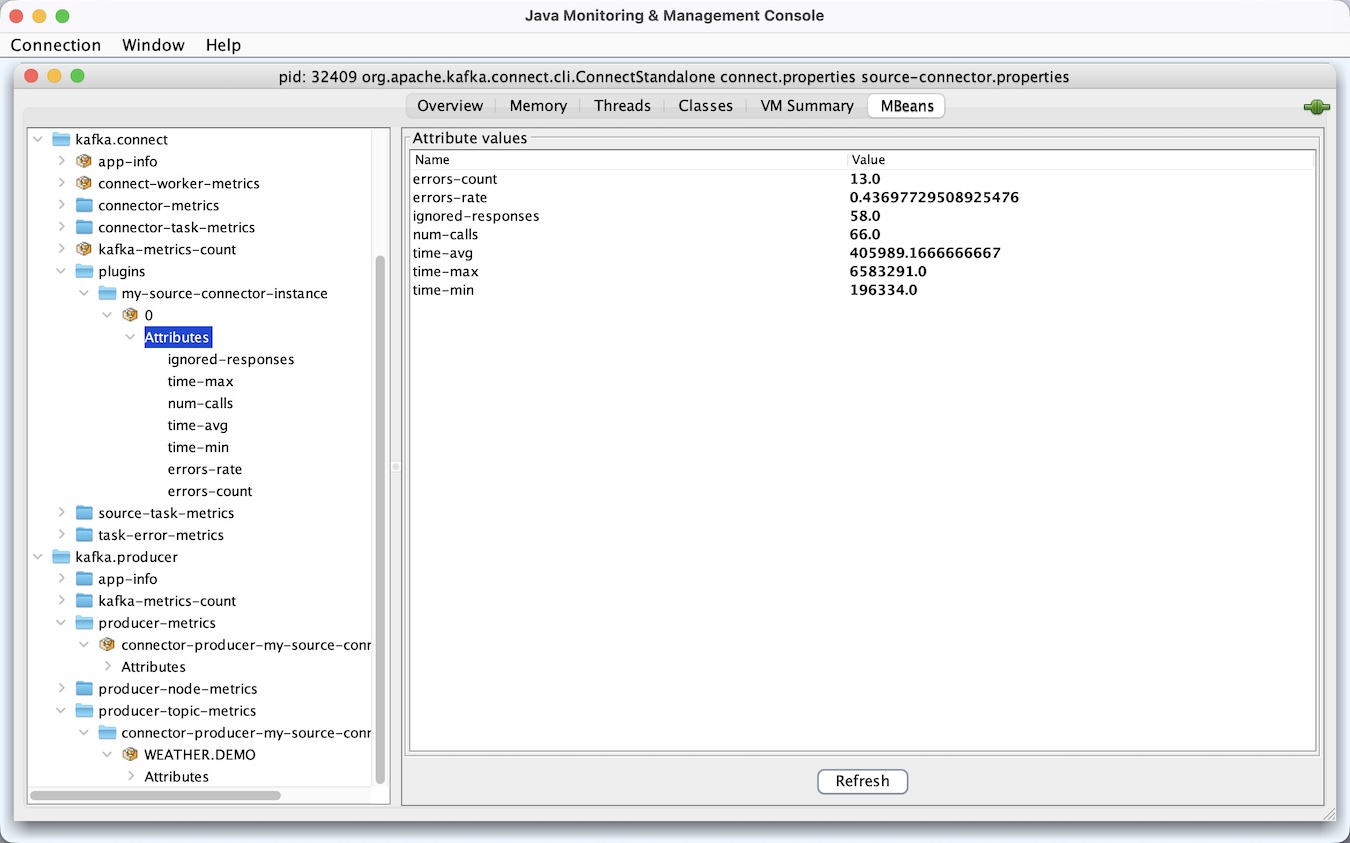
09-run-source-connector.sh– start the connector runningjconsole– fire up jconsole to see the metrics the Connector is emitting
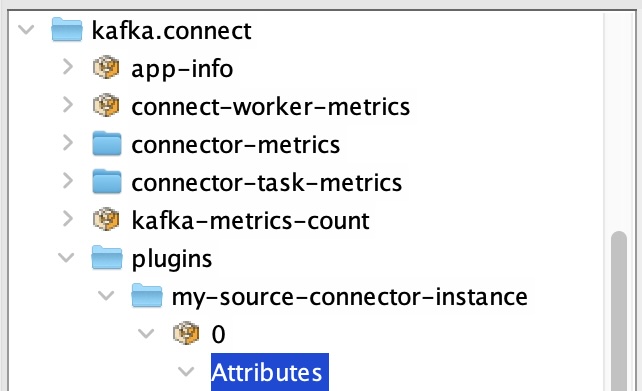
You’ll find your metrics at: kafka.connect -> plugins -> your-connector-id -> tasknum
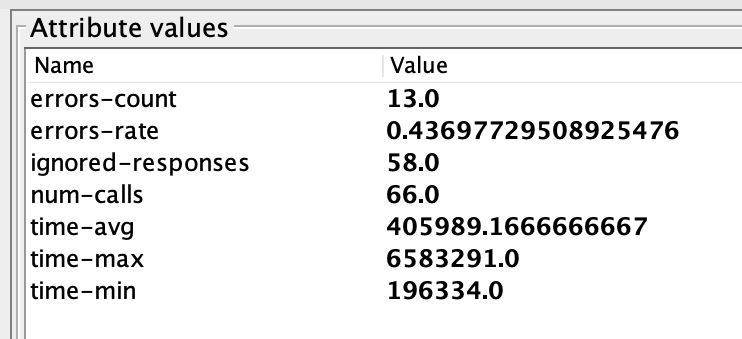
And you’ll see values for all the metrics I’ve described above.
Don’t reinvent the metrics wheel
A tip when doing this for your own connectors is to keep an eye on the metrics that are already available out of the box from the Connect framework, and the Kafka consumers/producers used by your connector.
A lot of metrics that you might be tempted to try and create in your specific connector might already be available to you from the framework as generic metrics. Instead of recreating those, focus on metrics that give insight into the unique behaviour and implementation of your own connector.
Alerting, visualisations, dashboards
jconsole is useful for a quick and easy test on my laptop, but obviously I’d usually use something like a Grafana / Prometheus stack to track these metrics for real.
Tags: apachekafka, kafka