Told in pictures. I thought this was kinda neat.
What does Solent Youth Action do?
September 27th, 2010What will happen to v?
September 13th, 2010Solent Youth Action‘s biggest project is vinvolved – delivering the vinvolved national volunteering programme.
When I say it’s our biggest project, there are different ways you could measure this – number of young people helped, number of volunteering hours contributed, etc. It’s not a definitive thing.
One way of measuring is by income. Our finances are all on the charity’s website, but let me pick out a small summary.
The funding we receive from vinvolved is the darker purple bit. The point I’m making is that they pay for a lot of what we do.
Making National Traffic Control data more useful
September 12th, 2010or ‘my hack for Over The Air 2010’
 Yesterday was Over The Air 2010 – a very cool event for mobile developers, that really warrants a post to itself, but I’m too tired so that will have to wait for another day.
But while I was there, I had a go at the hack challenge. I’m pleased that there was a fair amount of interest in what I did, so in this post, I want to share some of the technical details.
The hack centred around getting access to (pseudo-)realtime data about UK roads. It turns out that there is an effort to make traffic and road monitoring data available in a consistent, interchangeable format: DATEX II.
The DATEX site has a list of documentation for the traffic data made available for England, Scotland, Sweden, Italy, Spain, Portugal, Netherlands, and regions in France and Germany. For a data geek, this was quite a cool find 🙂
I only had 24 hours to play, so started with the data available for England – covering the motorway and trunk roads. The web page includes a 39-page PDF which documents the data that the National Traffic Control Centre publishes for England.
The nice thing about DATEX II being an agreed standard is that although I spent the evening working with the English traffic data, once the code was done, there wouldn’t be anything to stop me using the same code with the Scottish data too.
They publish a lot of data – more than I realised was being collected, let alone made publicly available. This chimed well with the keynote on Saturday morning by the brilliant Tim Berners-Lee, in which he talked about the importance of publicly available data.
The data includes:
- current and future planned roadworks
- current and future planned events expected to affect traffic
- unplanned events affecting traffic
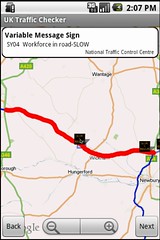
- the current message being displayed on variable message signs (the electronic traffic signs that can be set to display text messages like “don’t drink and drive”)
- the current graphic being displayed on matrix signs (those square electronic displays that can display icons like which motorway lanes are closed)
- information about traffic on monitored stretches of road
This was an impressive list – is it just me, or is the ability to find out what is currently written on the electronic sign hanging over every major road in the country seriously cool? No? Okay… so I’m a geek. 🙂
But beyond the list, what was impressive was the amount of detail.
 For roadworks, you can find out not only where they are, but what type of roadworks they are – e.g. resurfacing, barrier repairs, bridge repairs, etc., what times of day they will be active, when they are expected to finish, the anticipated level of disruption, number of lanes to be closed, and much more.
For events, you can find out the type of event (e.g. if it’s a sports event what type of sport, if it’s an entertainment event what type of entertainment – e.g. boat show), as well as details about times, expected level of disruption, and so on.
For unplanned events, there are codes for a variety of types of events e.g. Spillages are divided into types like chemical, oil, and – unusually – “shed load”. Accidents are categorised into serious, multi-vehicle, vehicle fire, vehicle recovery, overturned vehicle, and so on. Other event codes include animals on road, people on road, obstructions, severe weather like fog, rain, snow, ice, high winds, etc. And loads more. And again, you get all the detail about times, level of disruption and so on.
For the variable message signs, you get the message text itself, the location of the sign, the source of the message (which authority set it), and so on. For the matrix signs, you get the code for the icon being displayed, the location of the sign, the time the message was set, etc.
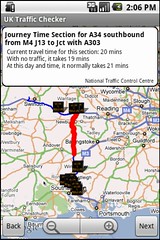
 For the traffic data, you get data divided into monitored stretches of road. In the England data, there were tens of thousands of these road sections. For each stretch of road, you get:
- current average travel times to traverse the section
- the typical travel for this stretch of road for this time and day of the week based on historical profiles
- the theoretical ideal travel time if there was no traffic
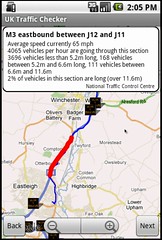
- the current average vehical flow rates (number of vehicles per hour) divided into the length of vehicle – how many vehicles shorter than 5.2m, how many vehicles between 5.2m and 6.6m in length, how many vehicles between 6.6m and 11.6m, and how many vehicles longer than 11.6m (the doc warns that “The accuracy of the loops when classifying vehicle lengths is 1% so measurements around each breakpoint could fall into adjacent categories” – like that’s a problem!)
- the current average vehicle speeds on the stretch of road
- the current average occupancy for the road
Not only was it detailed, but it was up-to-date. Data is updated at two-minute intervals if you pay for a premier account, or ten minute interals for the free standard account.
This was awesome. So much information!
What impact does SYA have on the community
August 21st, 2010![]() Last week, some of the staff and trustees of Solent Youth Action had an Away Day for strategy and planning a-plenty.
Last week, some of the staff and trustees of Solent Youth Action had an Away Day for strategy and planning a-plenty.
In one of the morning activities, we were ideastorming in small groups. My group had to identify what impact SYA has on the community.
I kinda liked the list we came up with. As the work of ten minutes or so of ideastorming, it’s not definitive or official in any way. But I thought it warranted sharing.
Adjusting mobile web font-sizes to fit screen resolutions
August 9th, 2010This might be obvious to someone less ignorant in the mystic ways of CSS, but I thought it was worth sharing anyway. 🙂
I was struggling to work out a suitable font-size for a mobile web page. Whether I tried using size names like “x-large”, or values with em, pt, px or %, the same basic problem remained:

Font-sizes were either too small on smartphones with high-resolution screens, or too large on other smartphones.
If I increased the font-size to look better on a high-res screen, it was too big for other phones. If I decreased the font-size for those other phones, it looked tiny on a high-res screen.
Seven years at Hursley
August 2nd, 2010Seven years ago this week, I started at IBM. Two years ago this week, I started my current job. Thought those were worth noting.

I joined IBM thinking it’d be for a couple of years to get training and experience before going to do something more fun at a start-up.
But seven years (four changes of jobs, three promotions, six changes of office and nine changes of manager) later, I’m still here and still loving what I do.
What do I share online?
July 15th, 2010I gave a presentation earlier this week which led to a discussion on information that people share online. The general experience from the group was along the lines of “we’ve heard of people who share a lot of information on facebook”, but that was about it.
I talked about some of the other ways that people share information online, and they were very surprised.
I’m guessing that anyone who reads my blog will likely find this less surprising, but I thought that the list we produced during the discussion was worth sharing nevertheless:
- what am I doing
- where am I now
- what do I think about stuff
- what book am I reading
- what am I watching on TV
- what music am I listening to
- what DVD am I watching
- what app am I using on my computer
- what video game am I playing
- how is my running going
- how much do I weigh
- what I want to buy
- how much electricity am I using
- what is in my diary and when am I available for meetings
- what events am I planning to go to
- what place am I planning to go to
- what places have I been to
- what websites am I bookmarking
- what articles am I reading online
- what presentations am I giving
- what photos am I taking
- what videos am I filming
- what photos am I taking of my kids
Ironically, I don’t use facebook all that much… 🙂
Android Market – a follow-up
July 15th, 2010A month ago, I submitted an app to the Android Market app store for the first time, and shared the experience – from compiling the app to it being live in the Market on people’s phones.
I thought I’d follow this up with a quick post on what happens after your app goes live in the Market.
Again, as before, this is aimed at the idle curiosity of people who use mobile app stores, rather than trying to replace the detailed documentation provided for mobile developers.
Crash reports
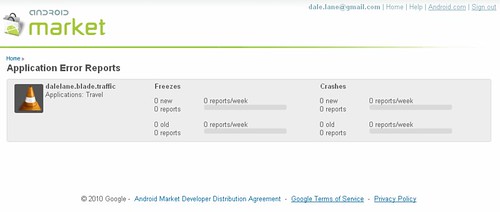
My favourite part are the Error Reports. As a developer, you can see when your app crashes on people’s phones. You can see how often it happens, how many people it has affected, and how many times it has happened.
I’ve not had any errors (I’m almost disappointed! 😉 ) so the screenshots on the Android developer’s blog are perhaps a better example. You can see that not only do you get told that an error has happened, but (as these are Java apps) you get the stack trace at the point of the error, telling you exactly where the app crashed.
This should make it a million times easier to debug buggy apps – it’s the sort of functionality that I’ve tried to manually build into apps before, but with Android you get it out-of-the-box. This is awesome.