A ramble about accuracy compared with NDCG scores for evaluating effectiveness of information retrieval. It’s an introduction, so if you already know what they are, you can skip this.
A couple of weeks ago, we released a new tool for training the IBM Watson Retrieve and Rank service (a search service that uses machine learning to train it how to sort search results into the best order).
This afternoon, I deployed a collection of small updates to the tool and thought I’d make a few notes about what’s changed.
Most of them are a bunch of incremental updates and minor bug fixes.
For example, support for a wider range of Bluemix environments, support for larger document cluster sizes, displaying the amount of disk space left in a cluster, and so on.
One update in particular I thought was more interesting, and worth explaining.
It’s something I’ve wanted to fix for a while, but didn’t get the time to before. I mentioned in my last post that the tool represents a minimum viable product, and that there were lots of great ideas and many possible features that there wasn’t time to include. But two things in particular bugged me – two things that I wish I’d managed to get done in time for our initial release. And this is one of them.
Evaluation
The tool needs to guide users through training the service. It also needs to evaluate how the training is going. This helps the tool decide how to drive the training next: the types of training task to give the user, the types of questions to focus on, and so on.
It’s also something we explain to the user, so that they have a feel for how their training is going, and the impact that their work is having.
We built this tool for someone who isn’t an expert in information retrieval or machine learning. That means we can’t show them a detailed dashboard with technical data. We can’t expect them to be able to interpret a learning curve. We decided to distill the results of the tests we run for them into a single figure. One metric that would represent a summarised view of the performance of the system they’ve trained.
Accuracy
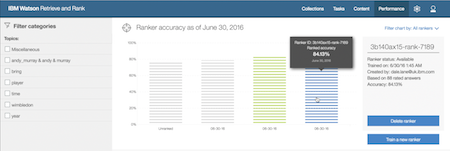
For the initial release, that metric was ‘accuracy@5’.
That is to say, the percentage of the questions where the system returned a correct answer in one of the first five responses.
I could argue that this is good because it’s easiest to understand for non-technical users. I could argue that typical use cases for search services like Retrieve and Rank will return a short list of answers, so if it’s returning something relevant in the first five answers then it’s doing a good job, making that a useful thing to measure. But really the biggest benefit was that it was very quick and easy to implement.
The problems with accuracy
However, there’s a lot I don’t like about it.
For example, imagine that for half the questions in the test, the service returns a list of answers like this:
-
 A terrible answer
- A truly awful answer
- A ridiculous non-sensical answer
- An unbelievably stupid answer
- A partial but correct answer
- …
The accuracy@5 score is 50%.
Half of the questions in the test met the requirement.
Now imagine you spend a few days diligently rating answers to questions. You do all the training tasks the tool prepares for you to continue training.
The test is run again. Imagine that for half the questions in the test, the service returns:
- An amazing perfect answer
- Another brilliant detailed answer
- A fantastic answer
- A very good answer
- A partial, but still correct and relevant answer
- …
The accuracy@5 score is 50%.
Half of the questions in the test met the requirement.
If that’s the only figure you look at, it looks like you haven’t achieved anything in all the training work you’ve done since the last test. It looks like you haven’t improved anything.
The metric fails to really describe the experience that someone would get from using the service, because it doesn’t differentiate between an answer that’s just okay and an answer that’s perfect.
And it doesn’t differentiate between returning the answer at the top of the list, and returning an answer further down the list.
And it doesn’t reflect the difference between easy questions and hard questions.
And it doesn’t acknowledge questions where a correct answer isn’t even in any of your documents.
And so on.
If the tool is only going to show a single metric, these sorts of issues are a problem. It’s not enough to let users know how their training is going. And this is what I mean by something that has bugged me.
Normalised Discounted Cumulative Gain
Now that the tool is out, I had some time to try a variety of alternate approaches, and I’ve settled on using NDCG scores.
NDCG stands for Normalised Discounted Cumulative Gain, and addresses most of the problems I had with using accuracy scores.
The easiest way to explain it is to start at the end, and work backwards…
Gain
You assign a value that represents the amount of gain you get from an answer that the system returns, based on how relevant it is. The more relevant, the more gain. And there’s no gain from an incorrect answer.
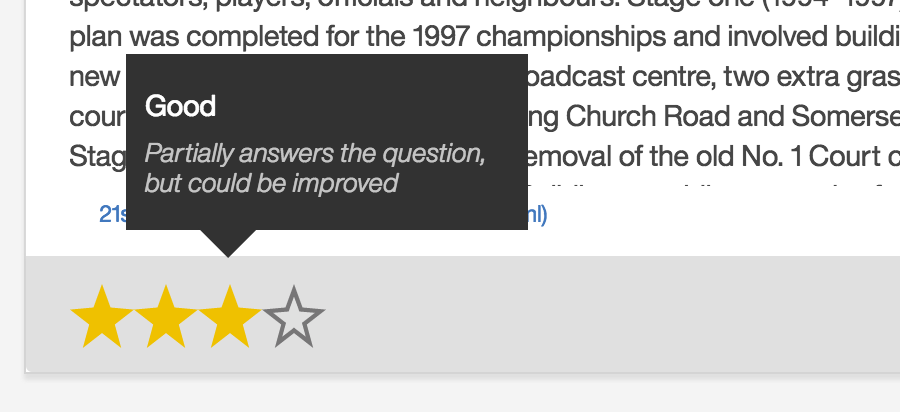
The tool is already guiding users to rate the answers they are shown as part of the training, so this maps to gain values very easily.
For example, I could say:
- perfect answers – gain of 3
- good answers – gain of 2
- answers that are at least in the right topic area – gain of 1
- incorrect answers – zero gain
There are different gain functions you can come up with, but this is what I’ve gone with for the tool, because it maps so neatly with the relevance labels we’re asking the users to collect already.
This means we’re rewarding a system that returns perfect answers more than one that returns answers that are just okay.
Cumulative gain
You add up the gain for the different answers that the system returns.
For example, if you’re interested in the first five answers that it returns to a question:
- perfect answer
- another perfect answer
- a good answer
- a good answer
- an incorrect answer
The cumulative gain is
3 + 3 + 2 + 2 + 0 = 10
(For the tool, I’ve gone with the cumulative gain for the first ten answers to every question, but you get the idea).
This means we’re rewarding a system that returns a range of good answers more than one that returns a good answer together with a load of rubbish.
Discounted cumulative gain
You discount the gain that an answer has, the further down the list it’s returned.
For example:
- gain (answer in first place gets the full gain score)
- gain / 2 (answer second in the list gets half of it’s gain score)
- gain / 3 (answer third in the list gets a third of it’s gain score)
- gain / 4 (answer fourth in the list gets a quarter of it’s gain score)
- gain / 5 (answer fifth in the list gets a fifth of it’s gain score)
In other words, using the same example as before…
- perfect answer
- another perfect answer
- a good answer
- a good answer
- an incorrect answer
The discounted cumulative gain (DCG) could be
3 + (3 / 2) + (2 / 3) + (2 / 4) + (0 / 5) = 5.7
There are different discounting functions you can use. The one I’ve described above is a little harsh. Halving the gain just because something is in 2nd place instead of 1st in a list of answers is probably too extreme a discount.
A more common function, and what I’ve gone with for the tool, is log2
- gain
- gain / log2 2
- gain / log2 3
- gain / log2 4
- gain / log2 5
e.g. The DCG would be
3 + (3 / log2 2) + (2 / log2 3) + (2 / log2 4) + (0 / log2 5) = 8.3
This means that we’re rewarding systems that return good answers higher in the list.
Normalised discounted cumulative gain
You normalise the score compared with the best possible score.
There might not be a perfect answer in any of your documents to one question.
Another question might have loads of perfect answers in several documents.
It’s not really fair to compare their scores – it’s not necessarily as easy to find perfect answers to one question as it is to find perfect answers to another.
So instead, we normalise them, compared with the DCG you’d get for the best possible known answers in the perfect order.
For example, imagine a system with only five known possible answers returned:
- An incorrect answer (gain = 0)
- A good answer (gain = 2)
- A perfect answer (gain = 3)
- A relevant answer (gain = 1)
- A perfect answer (gain = 3)
The DCG would be
0 + (2 / log2 2) + (3 / log2 3) + (1 / log2 4) + (3 / log2 5) = 5.7
The ideal DCG (iDCG) can be found by getting the score for:
- A perfect answer (gain = 3)
- A perfect answer (gain = 3)
- A good answer (gain = 2)
- A relevant answer (gain = 1)
- An incorrect answer (gain = 0)
The iDCG would be
3 + (3 / log2 2) + (2 / log2 3) + (1 / log2 4) + (0 / log2 5) = 7.8
The NDCG is DCG / iDCG and so would be
5.7 / 7.8 = 0.7
The final score is in a predictable range – from 0.0 to 1.0.
0.0 for a system that performs terribly, to 1.0 for a system that returns the best possible answers in the best possible order (because DCG and iDCG will be the same, and DCG/iDCG = 1)
This means that we’re rewarding a system based on how it returns from what is actually possible.
Explaining performance
Most of the users we’ve built the tool for won’t be aware of any of this. They won’t know what NDCG means or how the score was computed. And that’s fine. We’re showing them a single number and telling them that a bigger number means it’s doing better and a lower number is worse.
(That said, we’ve put “NDCG” in the UI so some knowledgable users will have an idea what it means, and the curious users can always Google it to find out)
Regardless, what we needed was to distill the performance of their trained system into a single metric. We needed one number that gives them a feel for how their training is going, factoring in the relevancy of the answers it’s returning and the order that they’re in. And of all the different metrics I’ve tried, I’m happiest with this one.
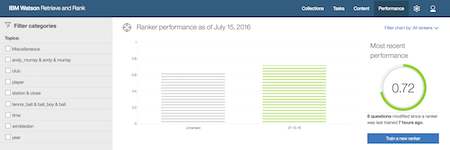
With this afternoon’s updates, users who start training new rankers will see the performance of their ranker in NDCG scores.
Excellent post, Dale. You really have a talent for teaching complex concepts.
Somewhat off-topic: The cognitive scientist is me is fascinated by how naturally we accept “top of the list” as the preferred position for “best” answer. This is not true for other concepts. For example, in math(s) if I want to count the total of several items, I typically list them in a top down order, then put the “answer” at the bottom, not the top. Maybe this is more of an accounting standard than math(s), but you see my point. In web queries (which is what NDCG was originally designed to evaluate, if I’m not mistaken) we accept top as the preferred location for the correct answer.
I wonder if this is driven by the fact that we tend to look down at computer screen, hence the top of the screen is easier to read? What if we used computers the way we use movie screen at the cinema, where they are huge? Would top = best? Just thinking out loud. Great post!
Thanks for the great post on NDCG!
In reading it through it strikes me that the hardest part about getting that metric is defining the ideal DCG, the denominator for normalization.
“”” For example, imagine a system with only five known possible answers returned: An incorrect answer (gain = 0) A good answer (gain = 2) A perfect answer (gain = 3) A relevant answer (gain = 1) A perfect answer (gain = 3) “””
I think the example of a system with five known possible answers is clear and useful. I’d love to hear your thoughts on how to determine the values for possible answers to questions in a live system.
We’ve run into difficulty in the past trying to determine for an arbitrary question + corpus whether the corpus can answer the question. The positive cases are straight forward, but for negative cases there’s the question of whether (A) the corpus doesn’t contain an answer or (B) the corpus does contain an answer, but the retrieval tools fail for some reason.
Great article. I wonder if this could be tweaked so that we extend it further then the last 5, in situations where we have answers with a rating of 2 and 3 after those 5 results, so that we do not cut off potentially useful results. In effect we stop calculating the DCG up until the point we get noise from the results – low rated answers.
This could help us catch troublesome questions.