IBM Event Streams brings Apache Kafka to IBM Cloud Private (together with a bunch of other useful stuff to make it easier to run and use Kafka).
Monitoring is an important part of running a Kafka cluster. There are a variety of metrics that are useful indicators of the health of the cluster and serve as warnings of potential future problems.
To that end, Event Streams collects metrics from all of the Kafka brokers and exports them to a Prometheus-based monitoring platform.
There are three ways to use this:
1) A selection of metrics can be viewed from a dashboard in the Event Streams admin UI.
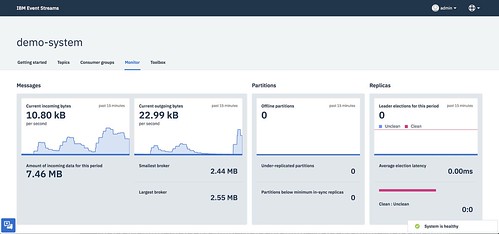
This is good for a quick way to get started.
2) Grafana is pre-configured and available out-of-the-box to create custom dashboards
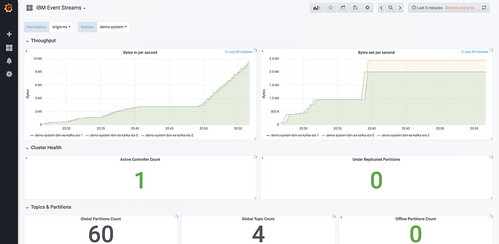
This will be useful for long-term projects, as Grafana lets you create dashboards showing the metrics that are most important for your unique needs. A sample dashboard is included to help get you started.
3) Alerts can be created, so that metrics that meet predefined criteria can be used to push notifications to a variety of tools, like Slack, PagerDuty, HipChat, OpsGenie, email, and many, many more.
This is useful for being able to respond to changes in the metrics values when you’re not looking at the Monitor UI or Grafana dashboard.
For example, you might want a combination of alert approaches like:
- metrics and/or metric values that might not be urgent but should get some attention result in an automated email being sent to a team email address
- metrics and/or metric values that suggest a more severe issue could result in a Slack message to a team workspace
- metrics and/or metric values that suggest an urgent critical issue could result in creating a PagerDuty ticket so that it gets immediate attention
This post is about this third use of monitoring and metrics: how you can configure alerts based on the metrics available from your Kafka brokers in IBM Event Streams.
I’ll use Slack as a worked example for how to set up an alert for a specific metric value, but the same approach and config would work for the variety of use cases described above.
The steps described below are:
- Preparing the destination where the alerts will be sent (e.g. Slack, PagerDuty, etc.)
- Choose the metric(s) that should trigger an alert
- Specify the criteria that should trigger the alert
- Define where the alert should be sent
- Testing and viewing the alerts
Preparing the alert destination
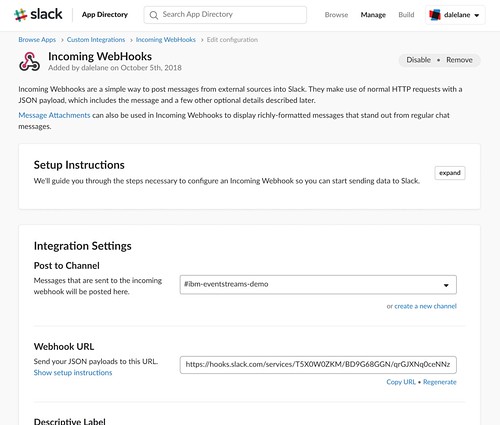
In this case, I’m using Slack. The first step is to create an Incoming Webhook for my Slack workspace.
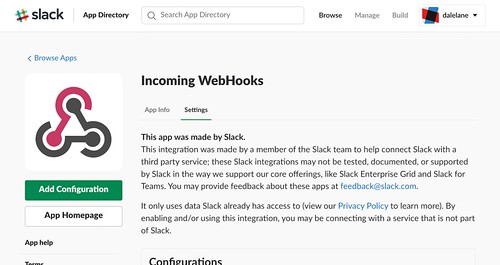
The value I need is the webhook URL.
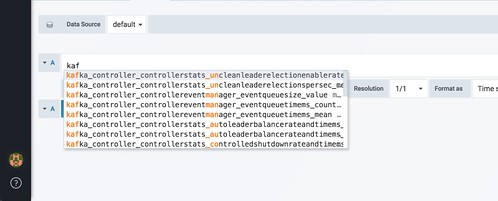
Choose the metric(s) to trigger an alert
One quick way to get a list of the metrics that are available is to use the drop-down list provided when you add a new panel in Grafana.
A better way is to use the Prometheus API to fetch the labels available – an HTTP GET to https://CLUSTERIP:8443/prometheus/api/v1/label/__name__/values is a good starting point.
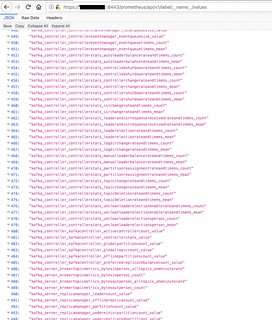
An explanation of what the different metrics mean can be found in Monitoring Kafka.
(Note that not all of the metrics that Kafka can produce are published to Prometheus by default. The metrics that are published are controlled by a config-map.)
For the rest of this post, I’ll be using the number of under-replicated partitions.
Specifying the criteria for an alert
The next step is to specify the criteria that should trigger an alert. The place to do that is the monitoring-prometheus-alertrules config map.
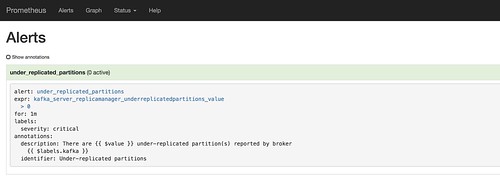
Start by having a look at the default empty list of rules. It should look something like this:
dalelane$ kubectl get configmap -n kube-system monitoring-prometheus-alertrules -o yaml

apiVersion: v1
data:
  alert.rules: ""
kind: ConfigMap
metadata:
  creationTimestamp: 2018-10-05T13:07:48Z
  labels:
    app: monitoring-prometheus
    chart: ibm-icpmonitoring-1.2.0
    component: prometheus
    heritage: Tiller
    release: monitoring
  name: monitoring-prometheus-alertrules
  namespace: kube-system
  resourceVersion: "4564"
  selfLink: /api/v1/namespaces/kube-system/configmaps/monitoring-prometheus-alertrules
  uid: a87b5766-c89f-11e8-9f94-00000a3304c0
For this post, I’ll be adding a rule that will trigger if the number of under-replicated partitions is greater than 0 for over a minute.
dalelane$ kubectl edit -n kube-system monitoring-prometheus-alertrules

apiVersion: v1
data:
  sample.rules: |-
    groups:
    - name: alert.rules
      #
      # Each of the alerts you want to create will be listed here
      rules:
      # Posts an alert if there are any under-replicated partitions
      #  for longer than a minute
      - alert: under_replicated_partitions
        expr: kafka_server_replicamanager_underreplicatedpartitions_value > 0
        for: 1m
        labels:
          # Labels should match the alert manager so that it is received by the Slack hook
          severity: critical
        # The contents of the Slack messages that are posted are defined here
        annotations:
          identifier: "Under-replicated partitions"
          description: "There are {{ $value }} under-replicated partition(s) reported by broker {{ $labels.kafka }}"
kind: ConfigMap
metadata:
  creationTimestamp: 2018-10-05T13:07:48Z
  labels:
    app: monitoring-prometheus
    chart: ibm-icpmonitoring-1.2.0
    component: prometheus
    heritage: Tiller
    release: monitoring
  name: monitoring-prometheus-alertrules
  namespace: kube-system
  resourceVersion: "84156"
  selfLink: /api/v1/namespaces/kube-system/configmaps/monitoring-prometheus-alertrules
  uid: a87b5766-c89f-11e8-9f94-00000a3304c0
(You only need to fill in the data section – the metadata will change when you make changes, but you can leave that alone).
Define where the alert should be sent
The next step is to define what should happen with the alerts. The place to do that is the monitoring-prometheus-alertmanager config map.
Start by having a look at the default empty list of receivers. It should look something like this:
dalelane$ kubectl get configmap -n kube-system monitoring-prometheus-alertmanager -o yaml

apiVersion: v1
data:
  alertmanager.yml: |-
    global:
    receivers:
      - name: default-receiver
    route:
      group_wait: 10s
      group_interval: 5m
      receiver: default-receiver
      repeat_interval: 3h
kind: ConfigMap
metadata:
  creationTimestamp: 2018-10-05T13:07:48Z
  labels:
    app: monitoring-prometheus
    chart: ibm-icpmonitoring-1.2.0
    component: alertmanager
    heritage: Tiller
    release: monitoring
  name: monitoring-prometheus-alertmanager
  namespace: kube-system
  resourceVersion: "4565"
  selfLink: /api/v1/namespaces/kube-system/configmaps/monitoring-prometheus-alertmanager
  uid: a87bdb44-c89f-11e8-9f94-00000a3304c0
For this post, I’ll be adding the Slack webhook I created before.
dalelane$ kubectl edit configmap -n kube-system monitoring-prometheus-alertmanager
apiVersion: v1
data:
  alertmanager.yml: |-
    global:
      # This is the URL for the Incoming Webhook you created in Slack
      slack_api_url:  https://hooks.slack.com/services/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
    receivers:
      - name: default-receiver
        #
        # Adding a Slack channel integration to the default Prometheus receiver
        #  see https://prometheus.io/docs/alerting/configuration/#%3Cslack_config%3E
        #  for details about the values to enter
        slack_configs:
        - send_resolved: true

          # The name of the Slack channel that alerts should be posted to
          channel: "#ibm-eventstreams-demo"

          # The username to post alerts as
          username: "IBM Event Streams"

          # An icon for posts in Slack
          icon_url: https://developer.ibm.com/messaging/wp-content/uploads/sites/18/2018/09/icon_dev_32_24x24.png

          #
          # The content for posts to Slack when alert conditions are fired
          # Improves on the formatting from the default, with support for handling
          #  alerts containing multiple events.
          # (Modified from the examples in
          #   https://medium.com/quiq-blog/better-slack-alerts-from-prometheus-49125c8c672b)
          title: |-
            [{{ .Status | toUpper }}{{ if eq .Status "firing" }}:{{ .Alerts.Firing | len }}{{ end }}] {{ if or (and (eq (len .Alerts.Firing) 1) (eq (len .Alerts.Resolved) 0)) (and (eq (len .Alerts.Firing) 0) (eq (len .Alerts.Resolved) 1)) }}{{ range .Alerts.Firing }} @ {{ .Annotations.identifier }}{{ end }}{{ range .Alerts.Resolved }} @ {{ .Annotations.identifier }}{{ end }}{{ end }}
          text: |-
            {{ if or (and (eq (len .Alerts.Firing) 1) (eq (len .Alerts.Resolved) 0)) (and (eq (len .Alerts.Firing) 0) (eq (len .Alerts.Resolved) 1)) }}
            {{ range .Alerts.Firing }}{{ .Annotations.description }}{{ end }}{{ range .Alerts.Resolved }}{{ .Annotations.description }}{{ end }}
            {{ else }}
            {{ if gt (len .Alerts.Firing) 0 }}
            *Alerts Firing:*
            {{ range .Alerts.Firing }}- {{ .Annotations.identifier }}: {{ .Annotations.description }}
            {{ end }}{{ end }}
            {{ if gt (len .Alerts.Resolved) 0 }}
            *Alerts Resolved:*
            {{ range .Alerts.Resolved }}- {{ .Annotations.identifier }}: {{ .Annotations.description }}
            {{ end }}{{ end }}
            {{ end }}
    route:
      group_wait: 10s
      group_interval: 5m
      receiver: default-receiver
      repeat_interval: 3h
      #
      # The criteria for events that should go to Slack
      routes:
      - match:
          severity: critical
        receiver: default-receiver
kind: ConfigMap
metadata:
  creationTimestamp: 2018-10-05T13:07:48Z
  labels:
    app: monitoring-prometheus
    chart: ibm-icpmonitoring-1.2.0
    component: alertmanager
    heritage: Tiller
    release: monitoring
  name: monitoring-prometheus-alertmanager
  namespace: kube-system
  resourceVersion: "4565"
  selfLink: /api/v1/namespaces/kube-system/configmaps/monitoring-prometheus-alertmanager
  uid: a87bdb44-c89f-11e8-9f94-00000a3304c0
(As before, you only need to fill in the data section – the metadata will change when you make changes, but you can leave that alone).
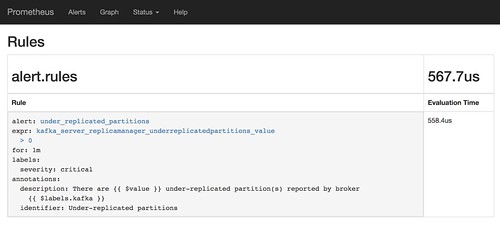
It might take a minute or two before the alert rule takes effect. You can tell when it is ready by reviewing the Alerts or Rules tabs in the Prometheus UI ( https://CLUSTER.IP:8443/prometheus )
That’s it.
All that remains is to show the alerts in action.
Testing – viewing the alerts
Individual alerts
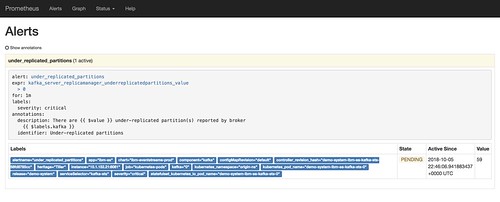
If I intentionally knock over one of the Kafka brokers in my cluster, I can see the effect in the Prometheus alerts view. In the time before the 1 minute threshold I specified is exceeded, the alert will show as PENDING.
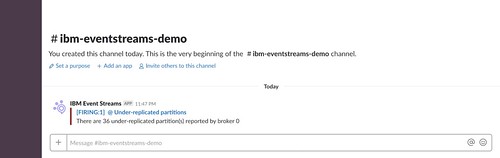
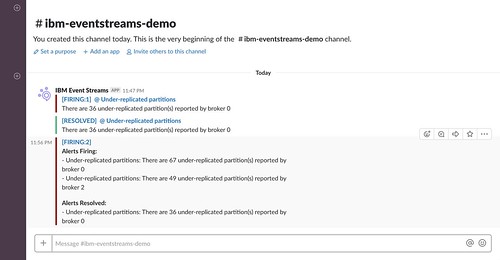
If the number of under-replicated partitions remains above 0 for a minute, that status changes to FIRING.
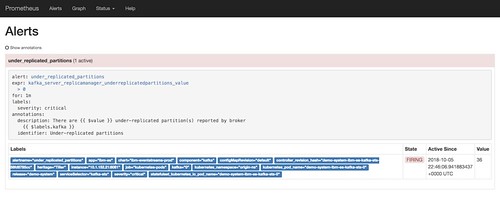
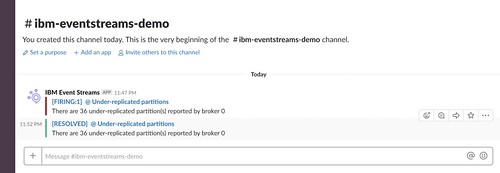
More importantly, an alert is posted to the receiver that I defined before – in this case, my Slack channel.
If I leave the cluster alone to recover, a new alert is posted once the number of under-replicated partitions returns to 0. (If you don’t want it to do that, you can set send_resolved to false in the config above).
Multiple alerts
Another example – but this time I’ll leave the broker “broken” for a bit longer. From the Grafana dashboard, you can create a view to monitor the same value.
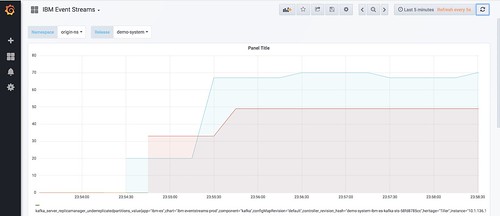
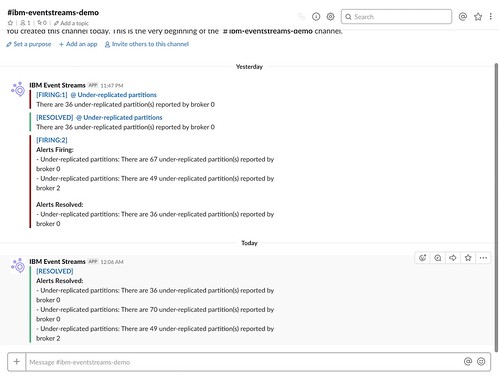
This time, there are two brokers that are reporting under-replicated partitions. The alerts that are posted can include multiple values in such cases:
I left the cluster in this state for a little longer this time.

As before, once the value returns to 0, a new notification is posted that the alert has been resolved.
Summary
You can use this technique to generate alerts in a variety of different applications, including HipChat, PagerDuty, OpsGenie, WeChat and sending emails. You can also use this technique to generate HTTP calls, which lets you easily do custom things with the alerts if you define a flow in something like Node-RED or App Connect.
Tags: apachekafka, eventstreams, ibmeventstreams, kafka