In this post, I’ll share a demo I gave today to explain some of the processing nodes in the palette of IBM Event Processing.
I’ve found that demonstrations of Event Processing are easier to understand when I don’t need to explain the stream of events I’m processing in the first place. This means I’m always looking for interesting real-world event streams that are widely understood, as they can make for the most effective demos.
With this in mind, today I tried explaining a few of the Event Processing nodes by using them with a live stream of events representing pages that are being created and edited in the English Wikipedia.
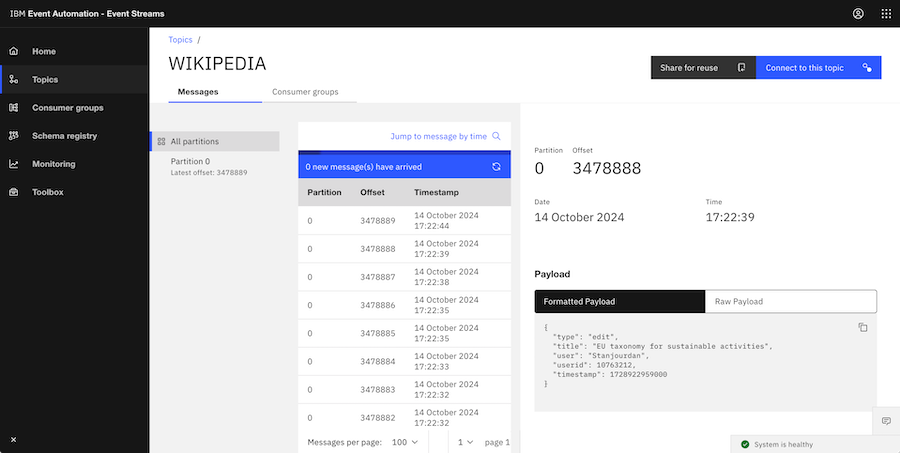
Click on the image for a higher-resolution screenshot
Each event contains:
- title of the page
- who made the edit (user ID if logged in, or IP address if anonymous)
- was this the creation of a new page, or an edit of an existing page?
Every edit on Wikipedia results in an event on the Kafka topic, so there are typically a few events a second. It’s not a super-high-throughput topic in Kafka terms, but there are enough events to try out interesting ideas.
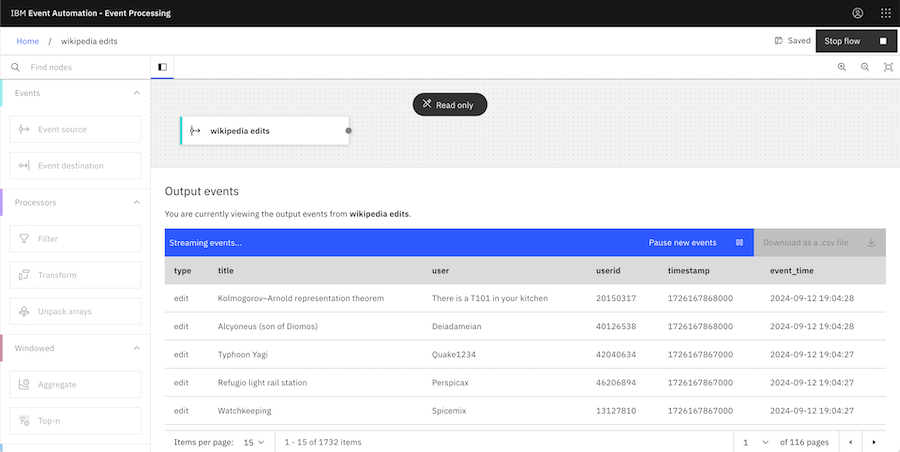
Click on the image for a higher-resolution screenshot
Here are a few of the demos I gave today.
This is by no means an exhaustive list of what you could do with this data, but it was enough to let me show what the most commonly-used tools in the palette can do.
How many Wikipedia edits are made per day?
The Aggregate node lets us easily count how many edits we can see in the event stream.

Click on the image for a higher-resolution screenshot
Aggregate node: edits per day
- Time window: 1 day
- Aggregate function: COUNT
Which Wikipedia pages were edited the most times each day?
Using the Aggregate node together with a Top-n node lets us count things, and then keep the ones with the highest counts.
For example, for each day, we can see which three pages had the most edit events.
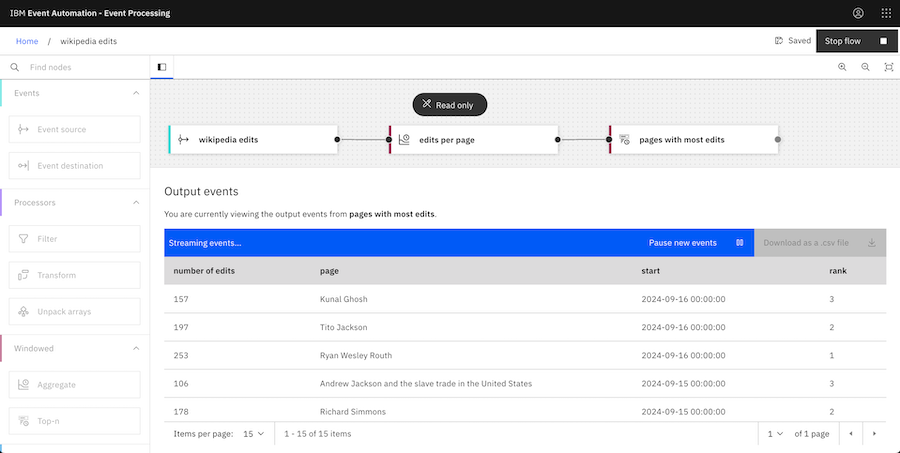
Click on the image for a higher-resolution screenshot
Aggregate node: edits per page
- Time window: 1 day
- Aggregate function: COUNT
- Group by: title
Top-n node: pages with most edits
- Number of results to keep: 3
- Ordered by: number of edits (descending)
Who made the most edits on Wikipedia each day?
Adding a Filter node before the Aggregate node means we only count the events that are relevant to our query – and then the Top-n node lets us keep the results with the highest counts.
For example, for each day, we can see which logged-in users produced the most edit events.
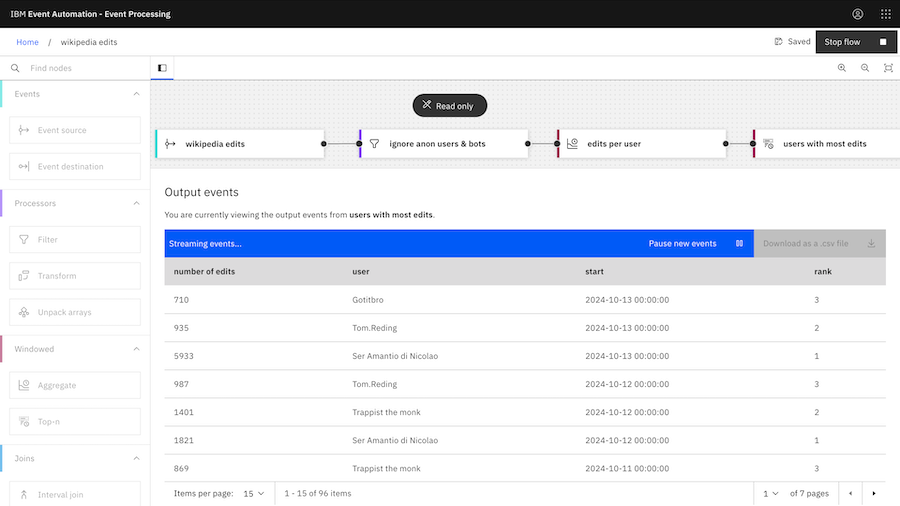
Click on the image for a higher-resolution screenshot
Filter node: ignore anon users & bots
- userid <> 0 (Wikipedia uses 0 to indicate anonymous users)
- userid <> ‘bot name’ (repeat this for the most popular bots, such as “Citation bot”, “InternetArchiveBot”, “WikiCleanerBot”, etc.)
Aggregate node: edits per user
- Time window: 1 day
- Aggregate function: COUNT
- Group by: user
Top-n node: users with most edits
- Number of results to keep: 3
- Ordered by: number of edits (descending)
Where are most of the anonymous Wikipedia editors?
For example, for each day, we can see the IP address where most of the anonymous edits were made from.
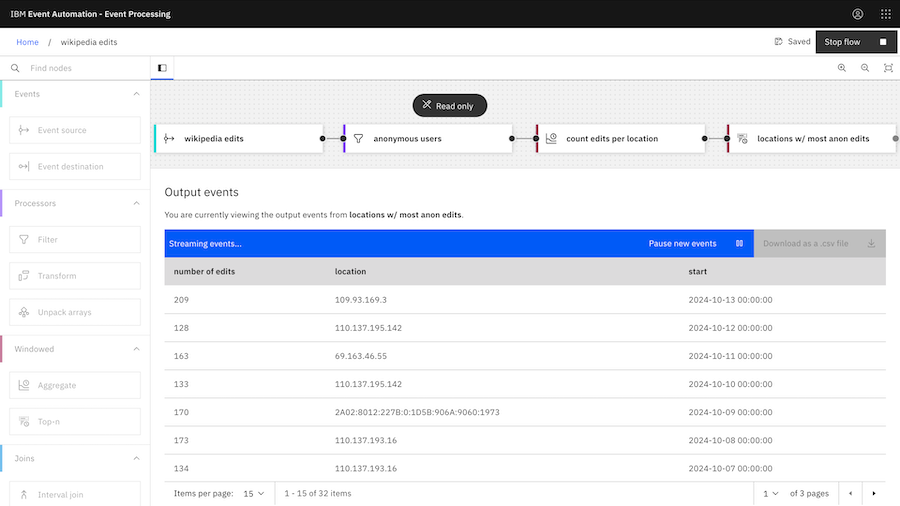
Click on the image for a higher-resolution screenshot
Filter node: anonymous users
- userid = 0 (Wikipedia uses 0 to indicate anonymous users)
Aggregate node: count edits per location
- Time window: 1 day
- Aggregate function: COUNT
- Group by: user
Top-n node: locations with most anon edits
- Number of results to keep: 1
- Ordered by: number of edits (descending)
How many anonymous Wikipedia editors have an IPv6 address?
Using a Transform node lets us derive new properties from the existing event attributes.
For example, using regular expressions on the IP address in the events for anonymous edits lets us recognise and count the number of edits from IPv4 and IPv6 addresses.
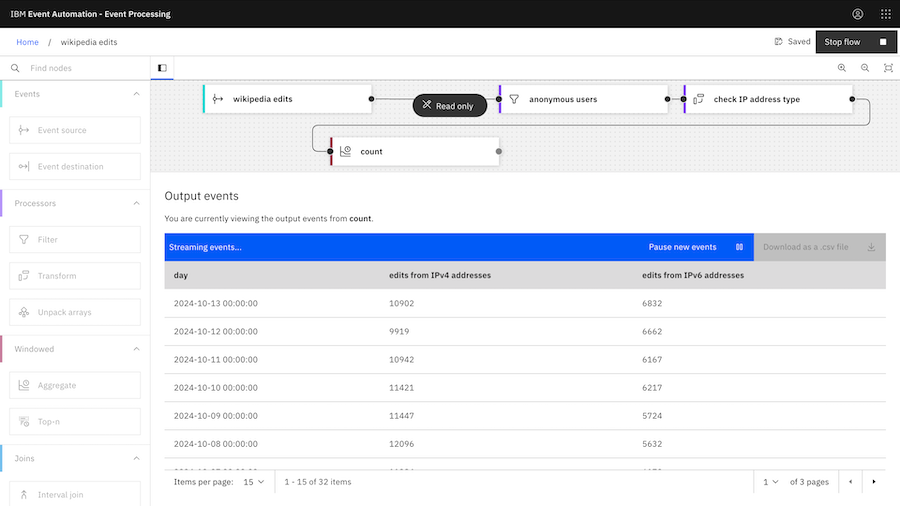
Click on the image for a higher-resolution screenshot
Filter node: anonymous users
- userid = 0 (Wikipedia uses 0 to indicate anonymous users)
Transform node: check IP address type
- isIPv4 =
IF(REGEXP(`user`, '\b(?:\d{1,3}\.){3}\d{1,3}\b'), 1, 0) - isIPv6 =
IF(REGEXP(`user`, '\b([0-9a-fA-F]{1,4}:){7}([0-9a-fA-F]{1,4})\b'), 1, 0)
Aggregate node: count
- Time window: 1 day
- Aggregate function: SUM isIPv4
- Aggregate function: SUM isIPv6
A Transform node also lets us transform results into a form that is easier to consume.
For example, we can take the raw count from the previous example, and turn them into percentages.
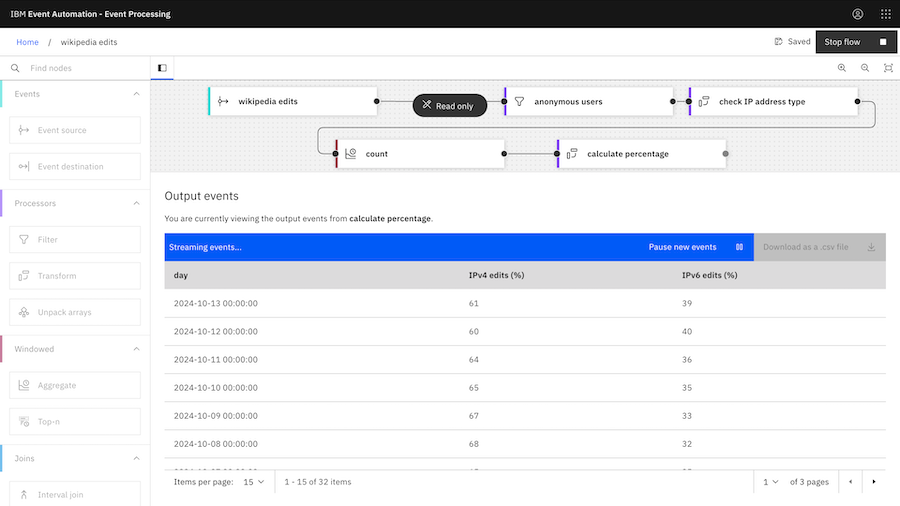
Click on the image for a higher-resolution screenshot
Transform node: calculate percentages
- IPv4 edits (%) =
ROUND(100 * CAST(`edits from IPv4 addresses` AS DOUBLE) / (`edits from IPv4 addresses` + `edits from IPv6 addresses`), 0) - IPv6 edits (%) =
ROUND(100 * CAST(`edits from IPv6 addresses` AS DOUBLE) / (`edits from IPv4 addresses` + `edits from IPv6 addresses`), 0)
Which new Wikipedia pages received the most edits in the first hour after creation?
Using an Interval join lets us make time-based correlations between event streams.
For example, if we split the Wikipedia events into events about creation of new pages, and events about edits of existing pages, we can correlate to see which new pages received the most edits.
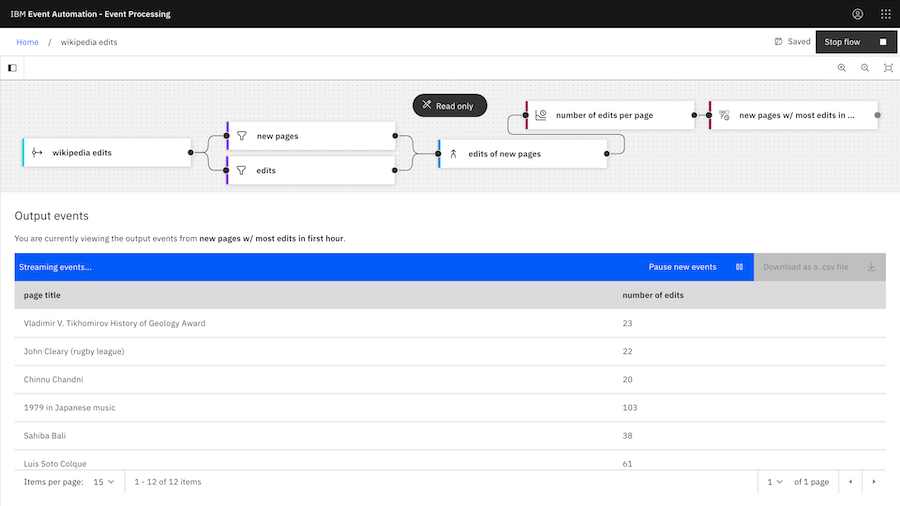
Click on the image for a higher-resolution screenshot
Filter node: new page
- type = ‘new’
Filter node: edits
- type = ‘edit’
Interval join node: edits of new pages
- Join condition:
`new pages`.`title` = `edits`.`title` - Time window: 1 hour from new pages event_time
Aggregate node: number of edits per page
- Time window: 1 day
- Aggregate function: COUNT
- Group by: page title
Top-n node: new pages with the most edits in the first hour
- Number of results to keep: 1
- Ordered by: number of edits (descending)
Want to try this for yourself?
If you’d like to recreate this demo for yourself, I have instructions for how to get access to this stream of events at github.com/dalelane/kafka-demos.
Tags: apachekafka, ibmeventstreams, kafka