In this post, I want to share a recent worksheet I wrote for Machine Learning for Kids. It is perhaps a little on the technical side, but I think there is an interesting idea in here.
The lesson behind this project
The idea for this project was to get students thinking about the differences between different language models.
There isn’t a “best” model, that is the best at every task. Each model can be good at some tasks, and less good at other tasks.
The best model for a specific task isn’t always necessarily going to be the largest and most complex model. Smaller and simpler models can be better at some tasks than larger models.
And we can identify how good each model is at a specific task by testing it at that task.
The project
In this project, students create a mini benchmark in Scratch, and test a variety of language models to see the answers that the models give to a specific type of question.
Students compare the different language models in two main dimensions:
- accuracy – how many questions the model gives a correct response to
- time – how quickly the model generates responses
They use Scratch to create tests that measure these, and also to generate visualisations that give them a deeper insight into each model’s behaviour.
The task
The task I chose for this project is to ask language models to answer maths questions – specifically simple addition sums (eg. “What is 12 + 74?”).
I chose this task for several reasons:
- It is easy for students to understand
- It is easy to generate a large number of test questions using Scratch code
- It is easy to automate checking the model’s answer in Scratch code, without needing to create a ground truth
- It is a task that some smaller and simpler models can outperform larger and more complex models at.
The models
The models that students use in the project are:
- SmolLM2-135M-Instruct (Hugging Face)
- Qwen2.5-0.5B-Instruct (Alibaba)
- TinyLlama-1.1B-Chat-v1.0 (Singapore Uni of Technology & Design)
- Llama-3.2-1B-Instruct (Meta)
- phi-1_5 (Microsoft)
- stablelm-2-zephyr-1_6b (Stability AI)
- gemma-2-2b-it (Google)
- RedPajama-INCITE-Chat-3B-v1 (Together)
The approach is that students divide up the models between themselves, so collectively the class can test all of the models. Smaller classes or code clubs might only test a subset of the models, but still follow the same process.
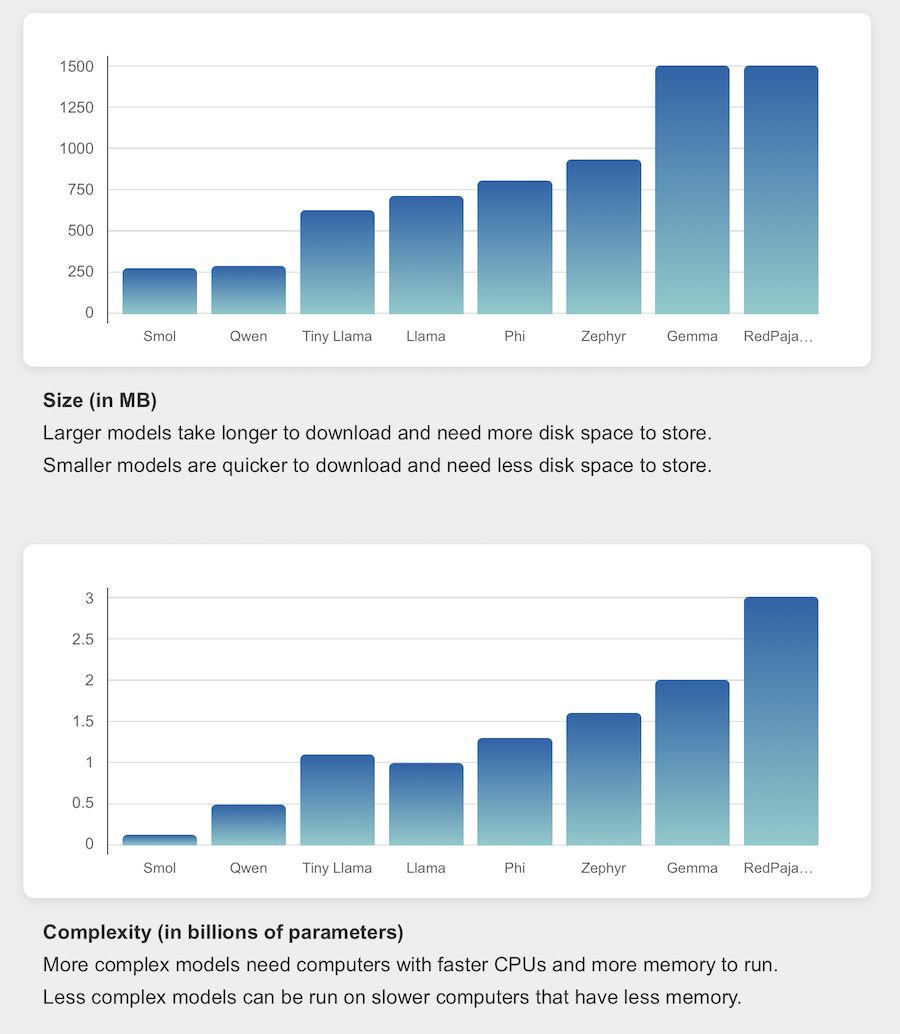
I selected these models to give a range of sizes, so the Machine Learning for Kids site displays interactive graphs to show the relative size and complexity of each model.
Accuracy
When I’ve tested the project, I’ve seen accuracy results like this:
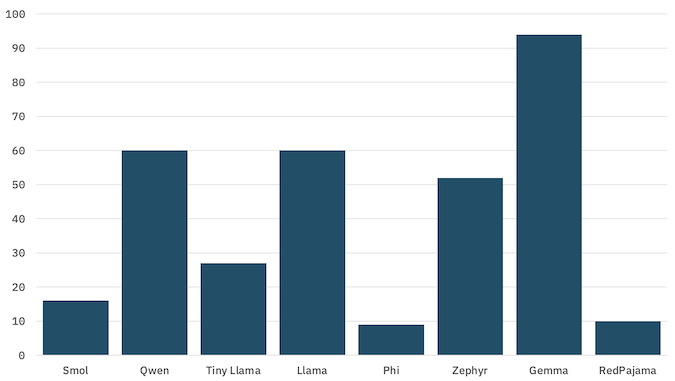
percentage of questions that the model gave the correct answer to
The actual test results that students get is less important than the opportunity for them to compare the accuracy results from their own testing with the model size and complexity. At the least, they’ll see that the performance of each model is different. Hopefully they’ll see for themselves that larger and more complex models are not always better at every task than smaller models.
(Gemma is obviously very good at this, but I was most impressed with how Qwen performed given it’s size!)
Temperature and Top-P
In the worksheet, I also get students to experiment with temperature and Top-P settings. This is a bit of a tangent, given the objectives for this project, and that I already covered this in other worksheets, but I think it’s interesting.
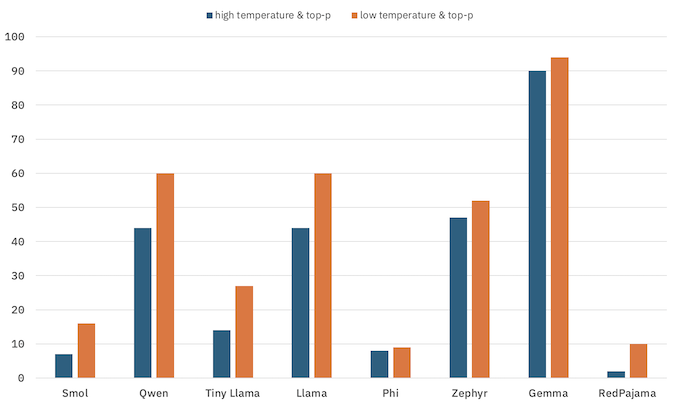
percentage of questions that the model gave the correct answer to
My expectation, and what I observed when I’ve tested the project, is that lower temperature and Top-P settings will result in a small improvement in accuracy. The Language models worksheet went more into the intuition for why than I did for this project – but I still thought it was a good lesson to revisit here.
Visualisations
Scratch is a fun tool to enable students to easily create data visualisations. In this project, students use Scratch to plot the questions that are submitted to the language model on a graph.
For example, if the question “What is 10 + 1000?” is generated, this would be plotted here.
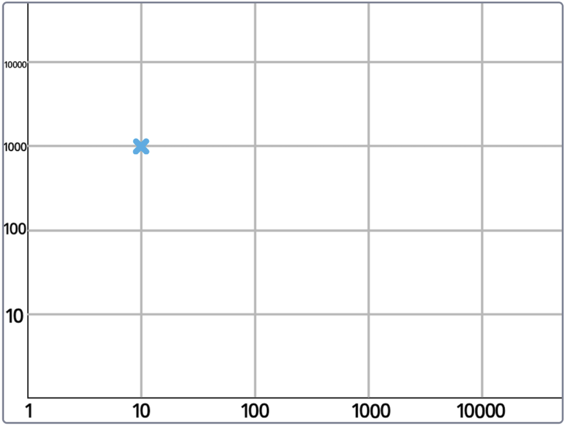
(I’m using a logarithmic scale to encourage students to see the model’s performance with a wider range of inputs… hopefully this won’t confuse them!)
The point is coloured green if the model gives the correct answer, and red if the model gives an incorrect answer.
This underlines just how good Gemma is at this:
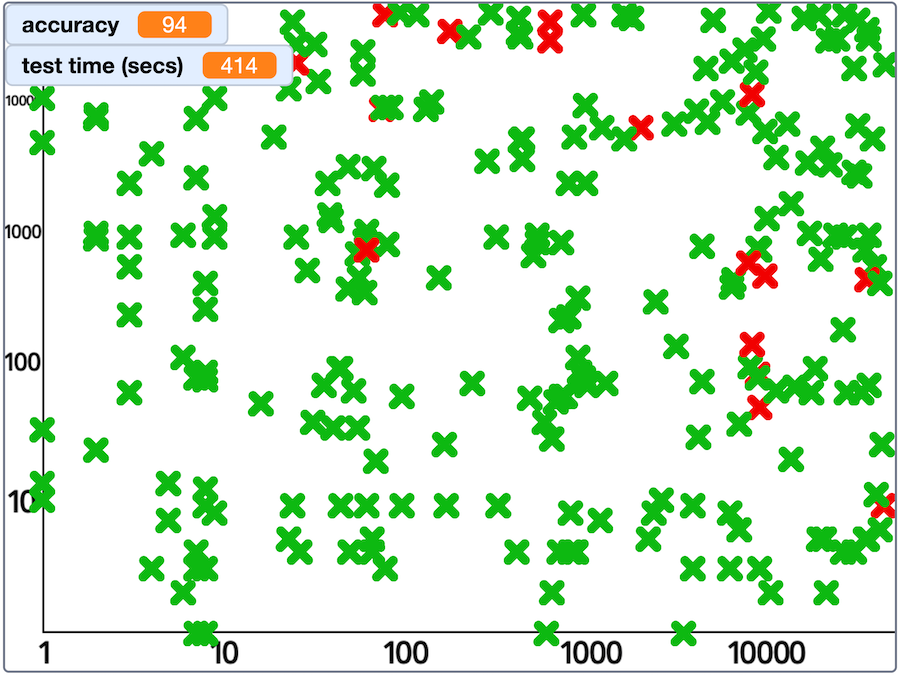
my results from a test with Gemma
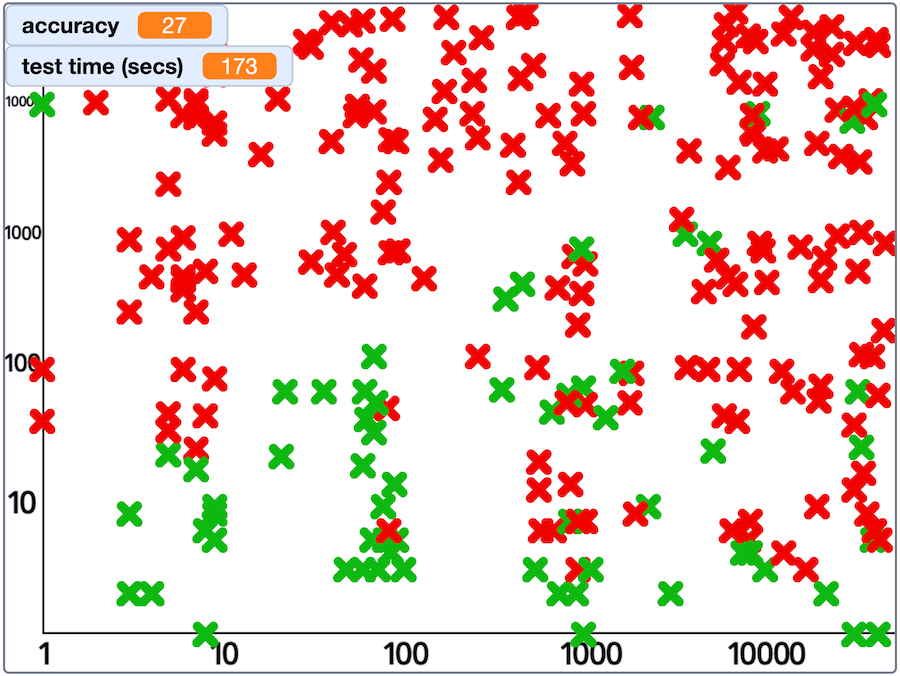
And shows how bad models like RedPajama were:
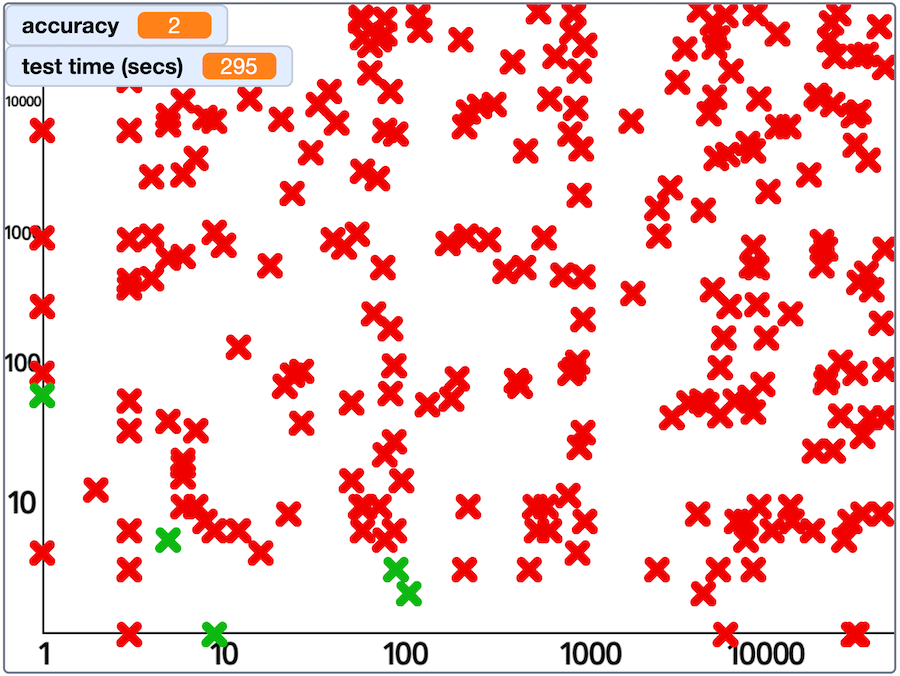
my results from a test with RedPajama
More importantly, I wanted this to help students get a better idea of the model’s behaviour than they can get from an overall accuracy score alone.
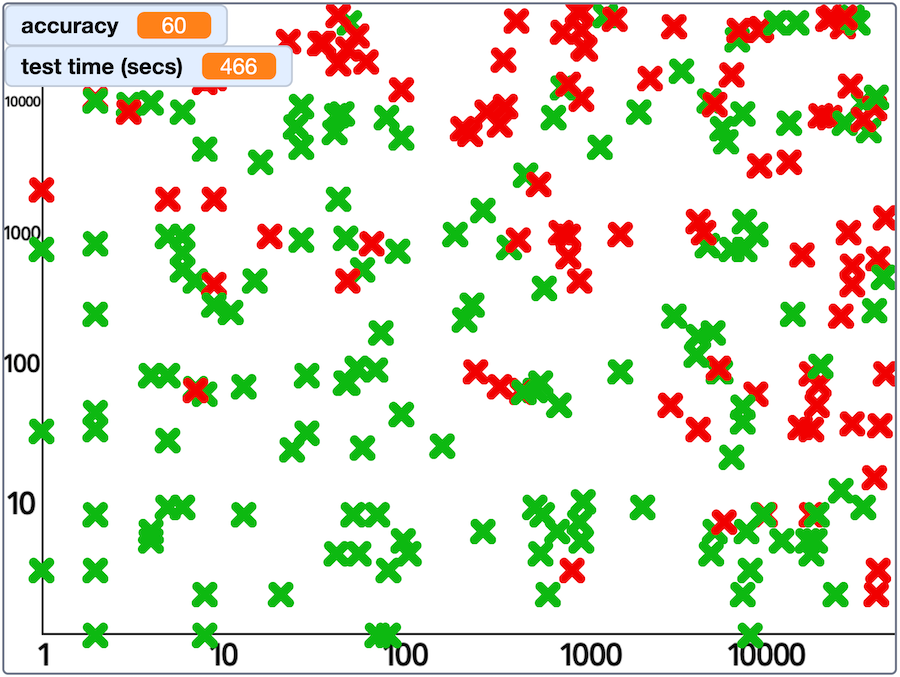
For example, the relatively low accuracy score that I got when I tried testing Phi is not as interesting as seeing that it gives correct answers for sums with small numbers, but then gets things wrong with larger numbers.
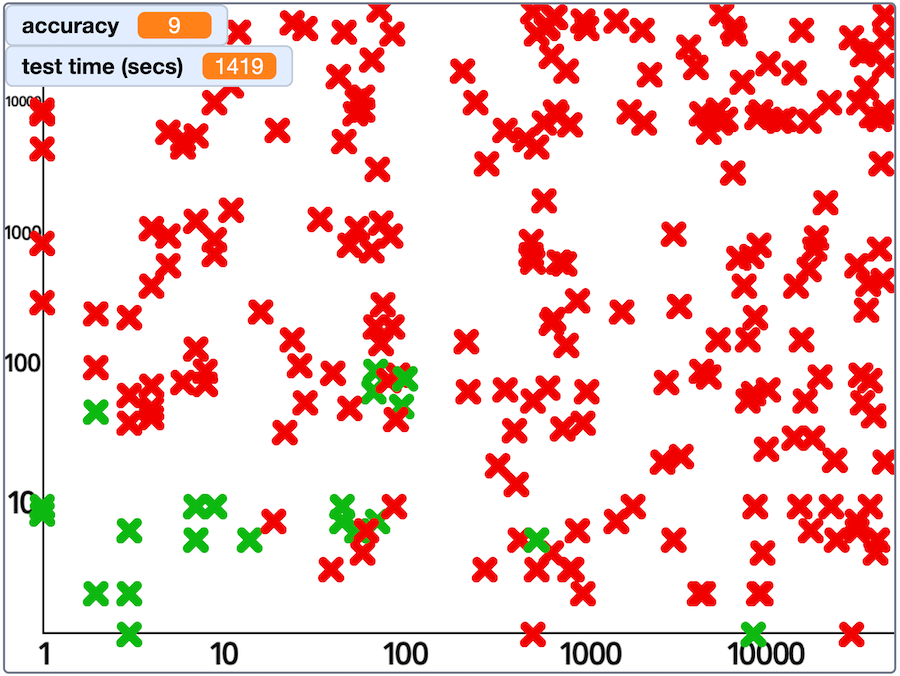
my results from a test with Phi
Intuitively, this seems reasonable for a language model that is treating the sums as regular English sentences to predict the most likely next token. Small sums like “What is 2 + 3?” are presumably relatively common in general documents, and large sums like “What is 9128 + 1724?” are perhaps unlikely to show up at all.
Qwen similarly seemed to struggle with very large numbers, but was still giving correct answers into the low-thousands.
my results from a test with Qwen
A little surprisingly, Tiny Llama seems to do better with larger numbers as the first number in a sum (e.g. “What is 4832 + 5?” which it tends to answer correctly) than it does with larger numbers as the second number in a sum (e.g. “What is 5 + 4832?” which it tends to answer incorrectly).
my results from a test with Tiny Llama
Overall, the aim is to get students to use Scratch to fire a lot of questions at their language model, and be creative in finding ways to display the answers that the model gives. And then to compare, consider, and discuss the different behaviours of each of the models that they are testing.
Accuracy isn’t the only important thing
I wanted the worksheet to help make the point that accuracy isn’t the only consideration when AI projects choose a model. Consider model A with an accuracy of 60% in testing and model B with an accuracy of 90% in testing.
I use the model size (number of parameters) as a proxy for model cost to get students to consider whether they would still choose model B if model B was six times more expensive to use than model A. For some jobs, where cost is important, maybe 60% accuracy is good enough?
Scratch has built in timer blocks, which make it easy to time how long their projects take to run – so I similarly ask students to consider when faster models might be a better choice, even if their accuracy is a little lower.
Learning about real benchmarks
Obviously, in the interest of keeping things simple and accessible, students are running a trivially simple test in this project. I’ve included some pointers to descriptions of real LLM benchmarks – and hopefully that will make more sense for students after they’ve gone through this taster first.
Feedback is welcome!
As I said at the top, this is certainly one of my more dry and technical worksheets. I hope there is still something in here that students will enjoy, but I haven’t had a chance to try it with a class yet. I’m sure that I’ll come back and improve it once I’ve had the opportunity to see how a class reacts to it, but – as always – if you try it with a class or code club, I’d love to hear what works and what could be improved.
You can find the worksheet at MachineLearningForKids.co.uk/worksheets.
Tags: machine learning, mlforkids-tech, scratch
This is brilliant! – so important to start to teach beyond the data collection phase of the data science/ ml pipeline/ phases and to think about the social and ethical costs/ implications of each stage! Brilliant!