IBM Event Streams brings Apache Kafka to IBM Cloud Private (together with a bunch of other useful stuff to make it easier to run and use Kafka).
Monitoring is an important part of running a Kafka cluster. There are a variety of metrics that are useful indicators of the health of the cluster and serve as warnings of potential future problems.
To that end, Event Streams collects metrics from all of the Kafka brokers and exports them to a Prometheus-based monitoring platform.
There are three ways to use this:
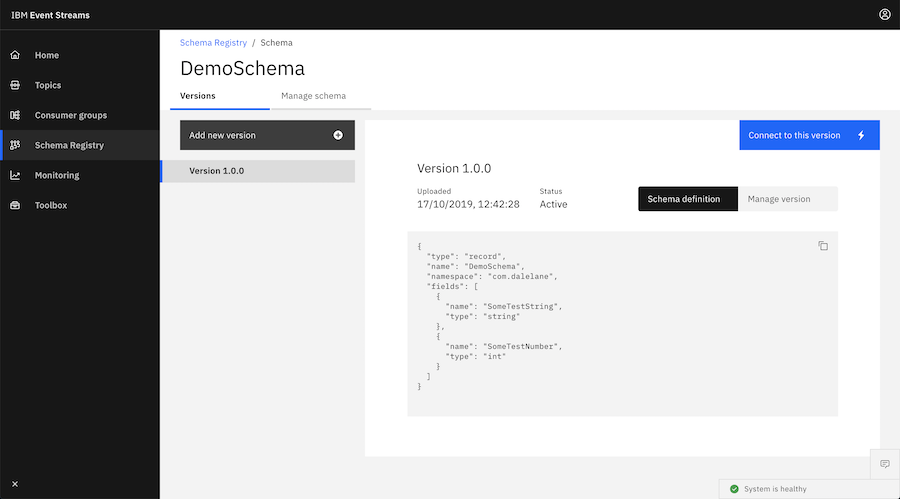
1) A selection of metrics can be viewed from a dashboard in the Event Streams admin UI.
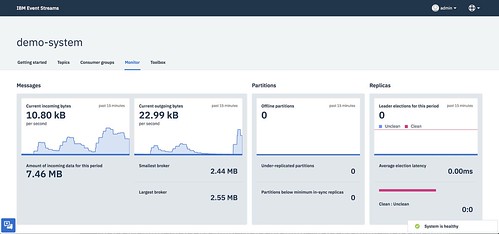
This is good for a quick way to get started.
2) Grafana is pre-configured and available out-of-the-box to create custom dashboards
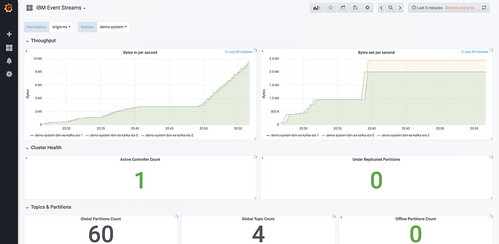
This will be useful for long-term projects, as Grafana lets you create dashboards showing the metrics that are most important for your unique needs. A sample dashboard is included to help get you started.
3) Alerts can be created, so that metrics that meet predefined criteria can be used to push notifications to a variety of tools, like Slack, PagerDuty, HipChat, OpsGenie, email, and many, many more.
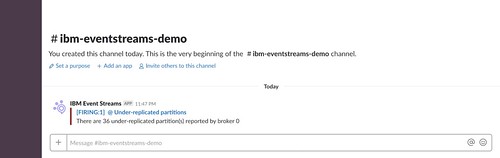
This is useful for being able to respond to changes in the metrics values when you’re not looking at the Monitor UI or Grafana dashboard.
For example, you might want a combination of alert approaches like:
- metrics and/or metric values that might not be urgent but should get some attention result in an automated email being sent to a team email address
- metrics and/or metric values that suggest a more severe issue could result in a Slack message to a team workspace
- metrics and/or metric values that suggest an urgent critical issue could result in creating a PagerDuty ticket so that it gets immediate attention
This post is about this third use of monitoring and metrics: how you can configure alerts based on the metrics available from your Kafka brokers in IBM Event Streams.
(more…)