One of the themes that came up at HomeCamp was that collecting data about personal energy usage was good, but putting it in a broader context helped make it more effective.
With that in mind, I thought I’d make a small improvement to my CurrentCost app to add a financial context to the data it displays.
I’ve added the ability to specify an annual electricity usage target – it asks the question “How much do you want to spend on electricity in a year?”
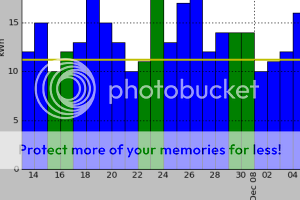
 Once you answer that, a target line is added to each graph. The target line shows how much electricity you should use in order to meet your goal.
For example, the graph showing daily electricity usage has a horizontal line showing how much electricity usage you can use a day in order to meet your target annual electricity spend. Bars in the graph that are taller than the horizontal line show you exceeding your goal, bars that stay under show you on track.
For a simple little feature, it’s proving interesting. Even just the trial-and-error involved in getting the line so that it roughly matches my current usage showed how I didn’t really know what I’m spending a year on electricity.
Incidentally, if you’ve not seen the app recently, I’ve been adding other features that I’ve not bothered writing posts about, such as the ability to get CurrentCost data via MQTT or the ability to annotate graphs. Check out the app’s Features page for a current list of the features I’ve added to the program.
Suggestions for new features to add are welcome, as always.
Tags: currentcost, electricity, energy, environmental, homecamp, homecamp08
That’s an awesome application that you’ve developed! Energy conservation has been one of the major goals for many households in my community. Just wondering if the device can be used in other countries other than the UK?
Cheers,
Ellesse
I don’t know – it’s worth contacting CurrentCost to ask
(http://www.currentcost.com/)