Posts Tagged ‘energy’

What will Smart Metering look like in the UK?

Sunday, December 6th, 2009

This week, the UK government published their response to the consultation that ran over the summer. Basically, they asked how smart metering should be implemented in the UK, offered some proposals, and invited anyone to tell them what they think.

In case I hadn’t already convinced people that I was a geek, I read through the Government response paper. It basically reiterates the proposals that were outlined before the summer, summarises the responses that they received, and states the decisions that they have reached as a result.

Is it really very geeky that I found this interesting?

I wanted to highlight a few bits in particular…

… mandate a roll out of electricity and gas smart meters to all homes in Great Britain with the aim of completing the roll out by the end 2020 …

In case you missed all the press about this in the past week, the plan is still that we’re all getting smart meters, and it’ll happen in the next ten years.

(more…)

How much did I spend on electricity to do that?

Friday, November 27th, 2009

Selecting a chunk of a graphTime for number 73 in my never-ending list of ever-so-slightly-different things to try with a graph of home energy usage data

🙂

This time… working out the electricity used (and the cost) of doing… well, something in particular.

We already have live graphs (Switch something on and watch the graph shoot up. Switch it off and watch the line drop.)

And we’ve already got graphs with hourly, daily, or monthly totals.

But if I boil a kettle, how do I know how much that cost?

The live graph shows you the shape of the usage curve for a particular appliance.

What I wanted was to be able to start the live graph running, switch something on, then after it’s finished, go back to the live graph, see the bump in the graph for when I did that, and measure the area under it – giving me my total energy usage for that time.

A quick bit of Python-tinkering later, and here we go

Click-and-drag to highlight a span of the graph, and the Python script calculates the area (more-or-less) under that part of the curve, using this to calculate how much energy I used during this time.

(more…)

Where did your electricity come from?

Monday, August 17th, 2009

Where did my electricity come from?It’s been a while since I posted about CurrentCost stuff, so time to share another little idea.

Last night I made a start on adding a new graph type to my CurrentCost application.

Instead of only displaying how much electricity you’ve used, the new graph displays the split of how that electricity was generated.

Realtime figures for the “energy mix” of ratios of different generation methods used in the UK National Grid are available in an XML feed that updates every five minutes.

(more…)

HomeCamp 2

Wednesday, May 20th, 2009

Saturday 25th April saw the return of HomeCamp. HomeCamp started last year as the brainchild of Chris Dalby, aiming to bring together a growing community of people interested in “green” hacking and technologies.

I’ve had this post sat in draft for weeks now, meaning to come back and turn them into proper notes. As it’s been a few weeks now and I still haven’t, I thought I might as well post my rough notes as I took them on the day. Apologies that they’re a little sketchy!

(more…)

CurrentCost – setting yourself a personal goal

Sunday, December 14th, 2008

One of the themes that came up at HomeCamp was that collecting data about personal energy usage was good, but putting it in a broader context helped make it more effective.

With that in mind, I thought I’d make a small improvement to my CurrentCost app to add a financial context to the data it displays.

I’ve added the ability to specify an annual electricity usage target – it asks the question “How much do you want to spend on electricity in a year?”

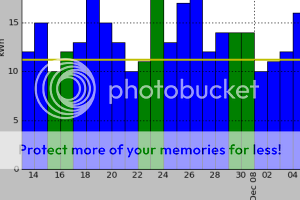
screenshotOnce you answer that, a target line is added to each graph. The target line shows how much electricity you should use in order to meet your goal.

For example, the graph showing daily electricity usage has a horizontal line showing how much electricity usage you can use a day in order to meet your target annual electricity spend. Bars in the graph that are taller than the horizontal line show you exceeding your goal, bars that stay under show you on track.

(more…)

HomeCamp

Sunday, November 30th, 2008

Yesterday was HomeCamp:

…an unconference about using technology to monitor and automate the home for greener resource use and to save costs. This is about low energy devices and servers, reducing your electricity bills, monitoring your mouse traps, home automation, monitoring your water usage, using solar power…

Fifty or so people came together at Imperial College to talk about how we can reduce our energy usage.

The format was different to other barcamps and unconferences I’ve been to – rather than separate rooms, most of the time was spent with everyone together in a single room. And the talks flowed on from each other – it felt more like a single day-long conversation than a series of separate presentations.

(more…)

Thinking about Home Camp

Monday, November 17th, 2008

This is a quick post to spread the word about Home Camp to anyone who follows my blog but doesn’t follow Chris Dalby (aka @yellowpark).

I’ve posted a lot about CurrentCost since I got the meter back in May, but in the past few months it seems like lots of people are giving it a try – I’m seeing more tweets and blog posts about the potential of CurrentCost, and I’m getting more and more emails about my Python CurrentCost app.

So I’m really looking forward to Home Camp – Chris’ idea for a CurrentCost-themed unconference, and a chance to discuss and try ideas relating to monitoring our energy use.

Although it’s CurrentCost-inspired, it wont be limited to CurrentCost or even only electricity monitoring. For example, I’ve prepared a short presentation on monitoring home gas usage in a CurrentCost-type way, which I hope will get some ideas going. And I’ve started thinking about how we could monitor personal car petrol usage – probably my most expensive energy bill!

(more…)