Posts Tagged ‘electricity’

What will Smart Metering look like in the UK?

Sunday, December 6th, 2009

This week, the UK government published their response to the consultation that ran over the summer. Basically, they asked how smart metering should be implemented in the UK, offered some proposals, and invited anyone to tell them what they think.

In case I hadn’t already convinced people that I was a geek, I read through the Government response paper. It basically reiterates the proposals that were outlined before the summer, summarises the responses that they received, and states the decisions that they have reached as a result.

Is it really very geeky that I found this interesting?

I wanted to highlight a few bits in particular…

… mandate a roll out of electricity and gas smart meters to all homes in Great Britain with the aim of completing the roll out by the end 2020 …

In case you missed all the press about this in the past week, the plan is still that we’re all getting smart meters, and it’ll happen in the next ten years.

(more…)

How much did I spend on electricity to do that?

Friday, November 27th, 2009

Selecting a chunk of a graphTime for number 73 in my never-ending list of ever-so-slightly-different things to try with a graph of home energy usage data

🙂

This time… working out the electricity used (and the cost) of doing… well, something in particular.

We already have live graphs (Switch something on and watch the graph shoot up. Switch it off and watch the line drop.)

And we’ve already got graphs with hourly, daily, or monthly totals.

But if I boil a kettle, how do I know how much that cost?

The live graph shows you the shape of the usage curve for a particular appliance.

What I wanted was to be able to start the live graph running, switch something on, then after it’s finished, go back to the live graph, see the bump in the graph for when I did that, and measure the area under it – giving me my total energy usage for that time.

A quick bit of Python-tinkering later, and here we go

Click-and-drag to highlight a span of the graph, and the Python script calculates the area (more-or-less) under that part of the curve, using this to calculate how much energy I used during this time.

(more…)

Where did your electricity come from?

Monday, August 17th, 2009

Where did my electricity come from?It’s been a while since I posted about CurrentCost stuff, so time to share another little idea.

Last night I made a start on adding a new graph type to my CurrentCost application.

Instead of only displaying how much electricity you’ve used, the new graph displays the split of how that electricity was generated.

Realtime figures for the “energy mix” of ratios of different generation methods used in the UK National Grid are available in an XML feed that updates every five minutes.

(more…)

Responding to the state of the National Grid

Sunday, February 15th, 2009

Okay, I know I said I’d stop banging on about CurrentCost stuff… sorry. My next post will be about something different. Honest! 😉

But with talk about Home Camp 2009 starting to pick up, it seems like a good time to remember one of the interesting factoids I picked up at Home Camp last year.

As I wrote at the time:

…the frequency of the electricity you receive from the National Grid is proportional to the ratio of supply vs demand for electricity usage on a national level…

There was a lot of discussion about how this information could be used to make a difference.
This is discussed in more depth at dynamicdemand, but the sort of thing we talked about was how you could make a significant difference without reducing your total electricity usage at all, but by shifting your usage to times when national supply is greater than the demand, and so when the energy is cheaper and more efficient to produce.

As I wrote at the time, it might be interesting to see what this looks like plotted against your own personal electricity usage.

Demonstrating my lightning quick l33t development skills, only ten weeks later, I got round to trying it out. 🙂

(more…)

CurrentCost – setting yourself a personal goal

Sunday, December 14th, 2008

One of the themes that came up at HomeCamp was that collecting data about personal energy usage was good, but putting it in a broader context helped make it more effective.

With that in mind, I thought I’d make a small improvement to my CurrentCost app to add a financial context to the data it displays.

I’ve added the ability to specify an annual electricity usage target – it asks the question “How much do you want to spend on electricity in a year?”

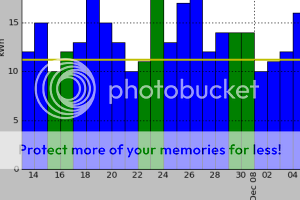
screenshotOnce you answer that, a target line is added to each graph. The target line shows how much electricity you should use in order to meet your goal.

For example, the graph showing daily electricity usage has a horizontal line showing how much electricity usage you can use a day in order to meet your target annual electricity spend. Bars in the graph that are taller than the horizontal line show you exceeding your goal, bars that stay under show you on track.

(more…)

HomeCamp

Sunday, November 30th, 2008

Yesterday was HomeCamp:

…an unconference about using technology to monitor and automate the home for greener resource use and to save costs. This is about low energy devices and servers, reducing your electricity bills, monitoring your mouse traps, home automation, monitoring your water usage, using solar power…

Fifty or so people came together at Imperial College to talk about how we can reduce our energy usage.

The format was different to other barcamps and unconferences I’ve been to – rather than separate rooms, most of the time was spent with everyone together in a single room. And the talks flowed on from each other – it felt more like a single day-long conversation than a series of separate presentations.

(more…)

A daily CurrentCost “bill”

Wednesday, May 28th, 2008

As I’ve finally got my home server capturing the electric meter readings from the CurrentCost, I thought it’d be good to try doing something with it.

I want to start with something a bit different to graphs, because there’s already been a lot of cool work done in different graphing approaches.

As I wrote yesterday, I’ve got a MySQL database that is storing the watt reading from the electric meter captured once every six seconds.

I wondered whether it makes sense to try and turn these figures into a financial cost. It might be interesting (and useful as a behaviour-altering thing) if we could get a “bill” from the CurrentCost meter each day that told us how much we spent on electricity the last day.

+=============================================+
  Your CurrentCost bill for 2008-5-27

     Electricity usage   4.9802 units
      Cost ==           £0.4874

     Standing charge    £0.1582
   ---------------------------------------
     TOTAL COST FOR 2008-5-27 : £  0.65
+=============================================+

I’m not entirely sure of my maths here, but I thought it could be interesting to give it a try.

(more…)