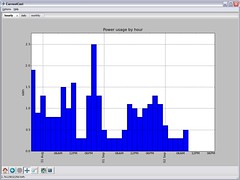
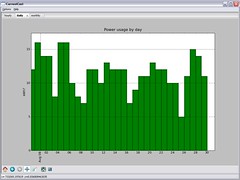
 I’ve been talking about it for a while, but I finally got around to spending some time working on a CurrentCost app.
The original code was written in C# using .NET 3.5, and I used WPF (Windows Presentation Foundation) to draw the graphs. For a number of reasons this proved unpopular and I got a ton of emails saying how this was no good for them. So I decided to start again.
The new app is written in Python – using wxPython and matplotlib to create the graphs.
 Using py2exe, I’ve been able to compile the whole thing (combining my script with a Python interpreter and a copy of all of the third-party libraries I’ve used) into a Windows executable that will (hopefully!) run on any Windows computer, without needing installing or requiring any pre-requisites.
I can also make the Python script itself available, making it something that Linux users could run as well. This means I get the low-overhead Windows experience I wanted, together with the ability to make it cross-platform. Neat!
I’ve been able to produce some more interactive graphs – the graphs in the new app can be zoomed in and out, panned, moved around, printed, and exported to images. As the amount of data in the app builds up, I can see this becoming very useful.