In this post, I want to share some changes I’ve been making to how I train models in Machine Learning for Kids.
Archive for the ‘code’ Category
Improving support for older computers and mobile devices on Machine Learning for Kids
Friday, January 16th, 2026Flink SQL examples with click tracking events
Monday, January 12th, 2026In this post, I introduce a few core Flink SQL functions using worked examples of processing a stream of click tracking events from a retail website.
I find that a practical, real-world (ish) example can help to explain how to use Flink SQL in a way that abstract descriptions, such as processing coloured blocks sometimes doesn’t quite achieve.
I’ll use this post to give examples of my most-used Flink SQL functions, in the context of a retail scenario: a stream of events from customers on the website for a clothing retailer.
Note: I used Event Processing to create the flows, as the assistants in the canvas helped me create examples quickly. Everything I’ve created is standard Apache Flink SQL, so you don’t need to have Event Processing to try these examples.
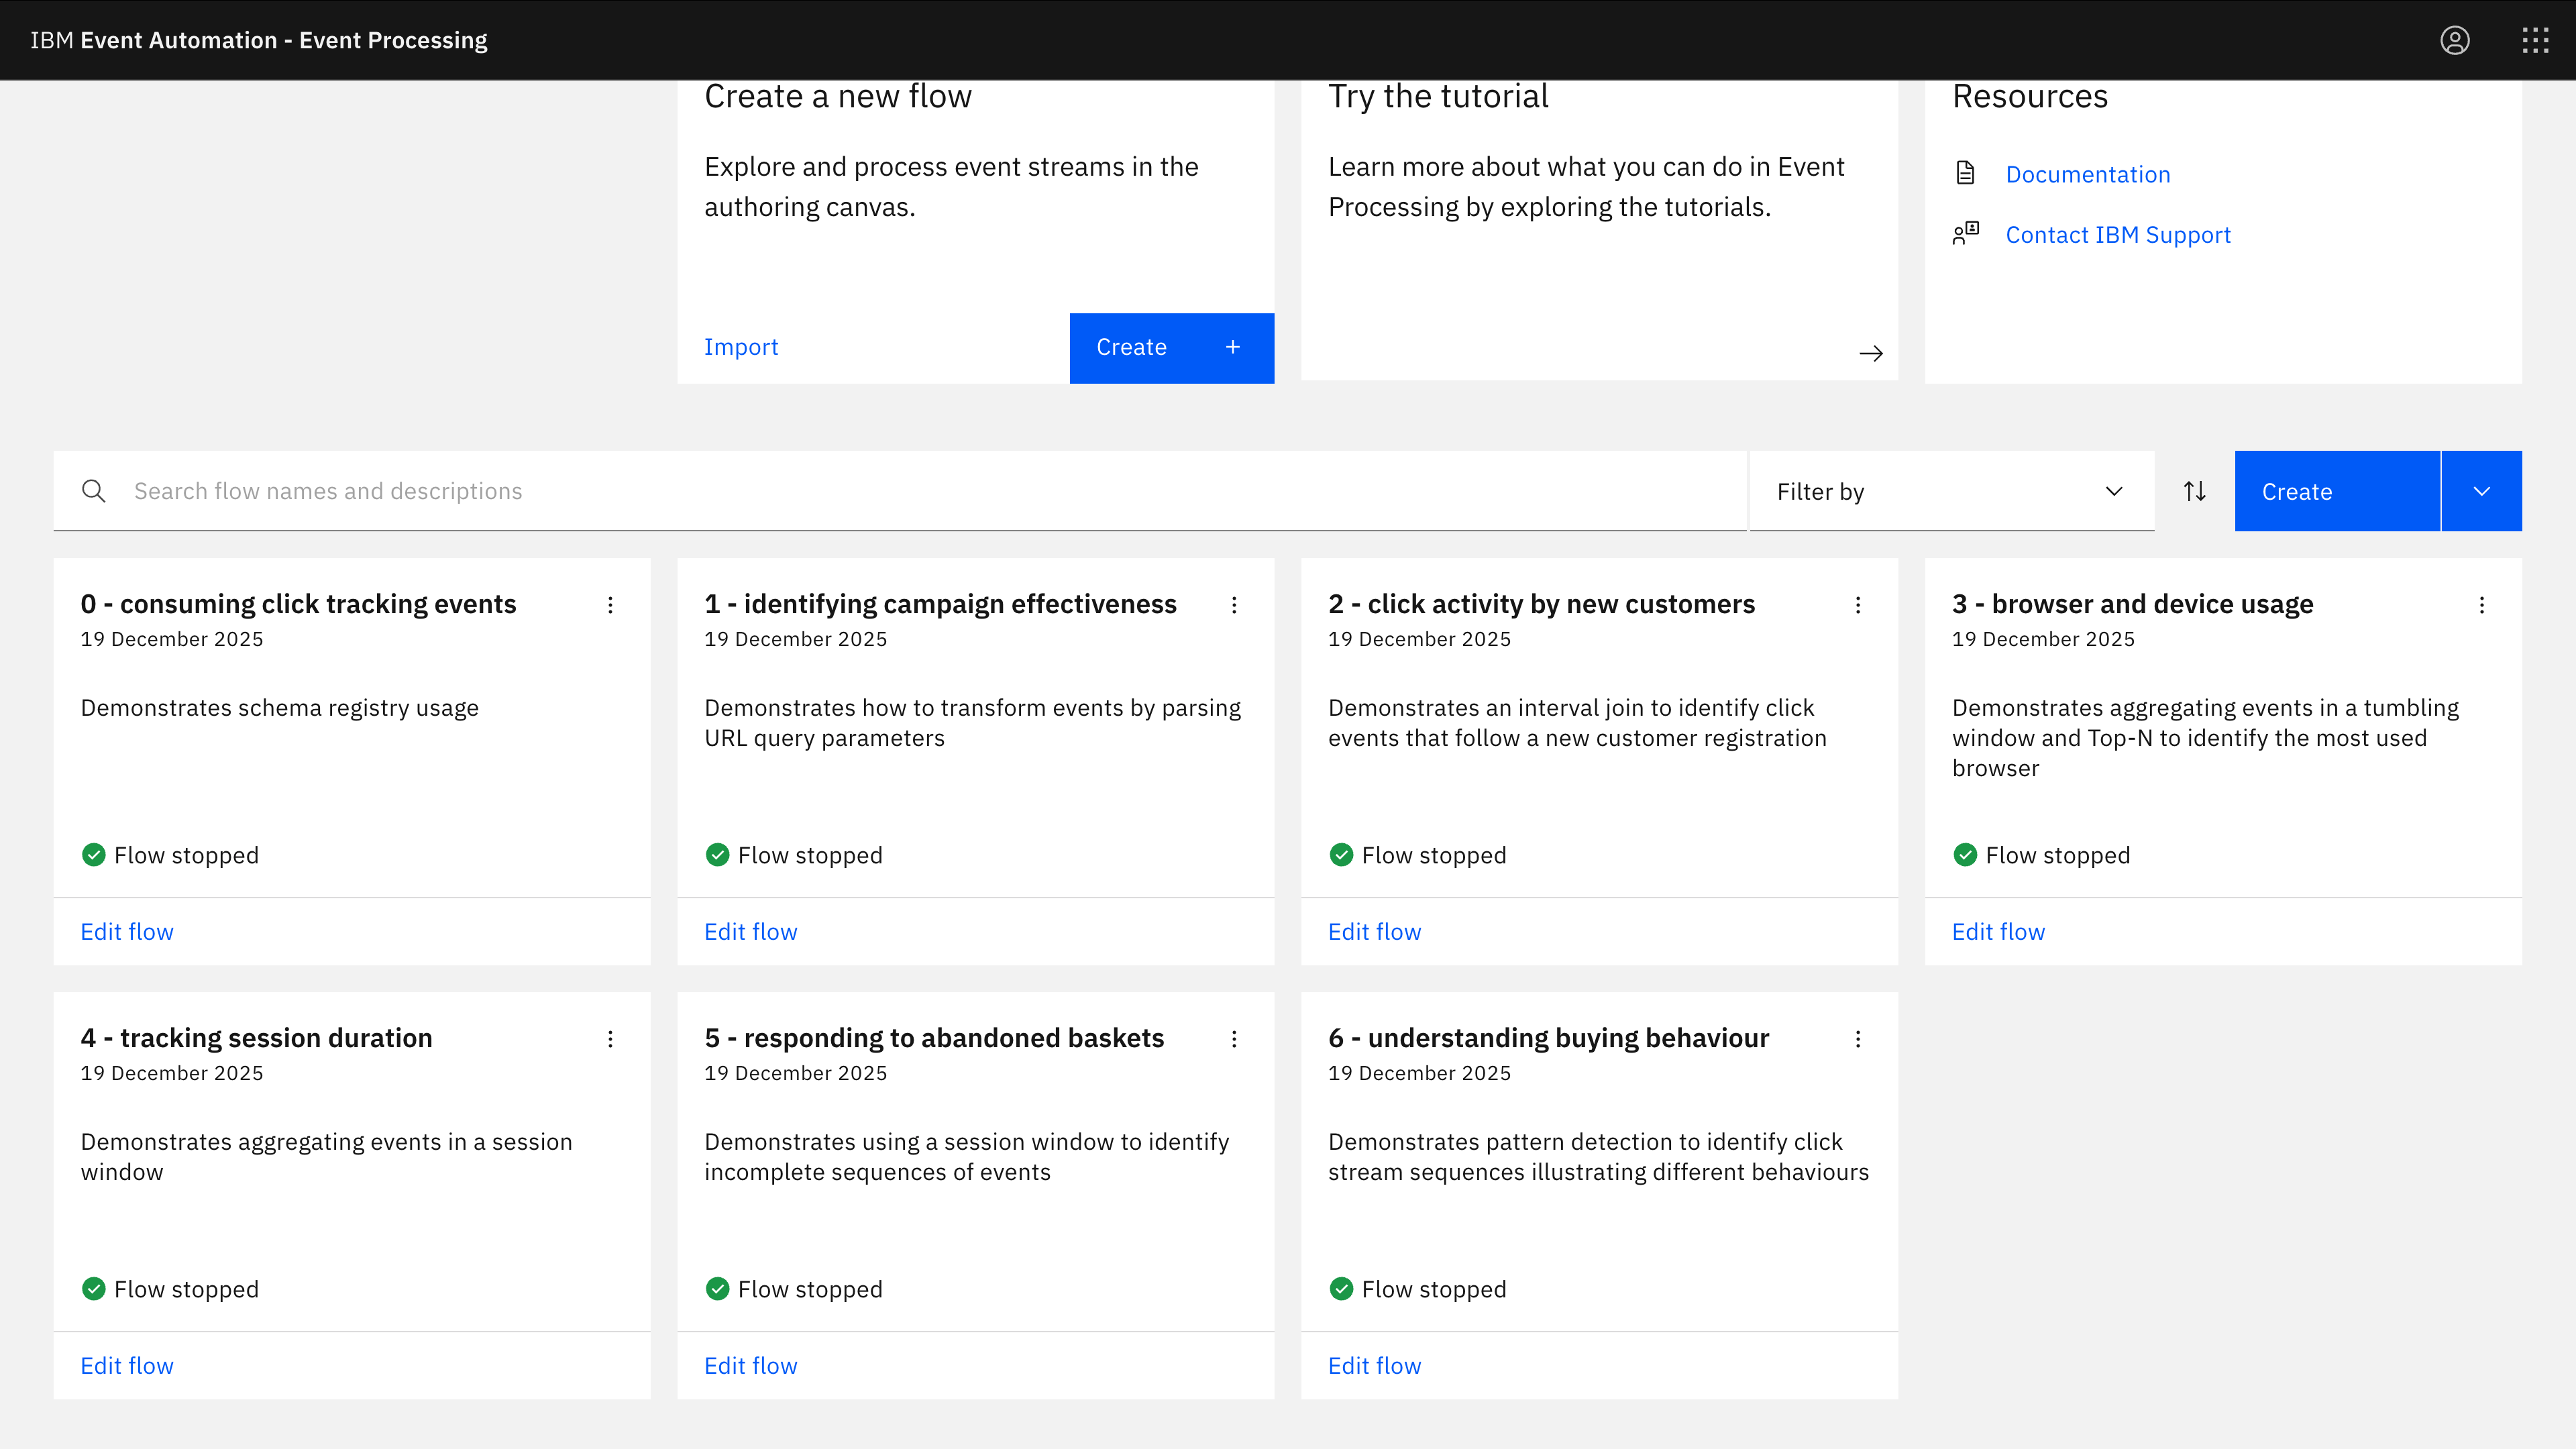
- The examples:
- 0 Consuming Avro – bring click tracking events into Flink
- 1 Transforming – deriving new properties
- 2 Joining – correlating with related event streams
- 3 Aggregating (tumble) – counting in a tumble window
- 4 Aggregating (session) – counting in a session window
- 5 Aggregating (session) – collecting in a session window
- Data – the events I’m processing in these examples
- Setup – how to recreate this if you want to try this for yourself
Flink SQL aggregate functions
Monday, November 3rd, 2025In this post, I want to share a couple of very quick and simple examples for how to use LISTAGG and ARRAY_AGG in Flink SQL.
This started as an answer I gave to a colleague asking about how to output collections of events from Flink SQL. I’ve removed the details and used this post to share a more general version of my answer, so I can point others to it in future.
Windowed aggregations
One of the great things in Flink is that it makes it easy to do time-based aggregations on a stream of events.
Using this is one of the first things that I see people try when they start playing with Flink. The third tutorial we give to new Event Processing users is to take a stream of order events and count the number of orders per hour.
In Flink SQL, that looks like:
SELECT
    COUNT (*) AS `number of orders`,
    window_start,
    window_end,
    window_time
FROM
    TABLE (
        TUMBLE (
            TABLE orders,
            DESCRIPTOR (ordertime),
            INTERVAL '1' HOUR
        )
    )
GROUP BY
    window_start,
    window_end,
    window_time
In our low-code UI, it looks like this:
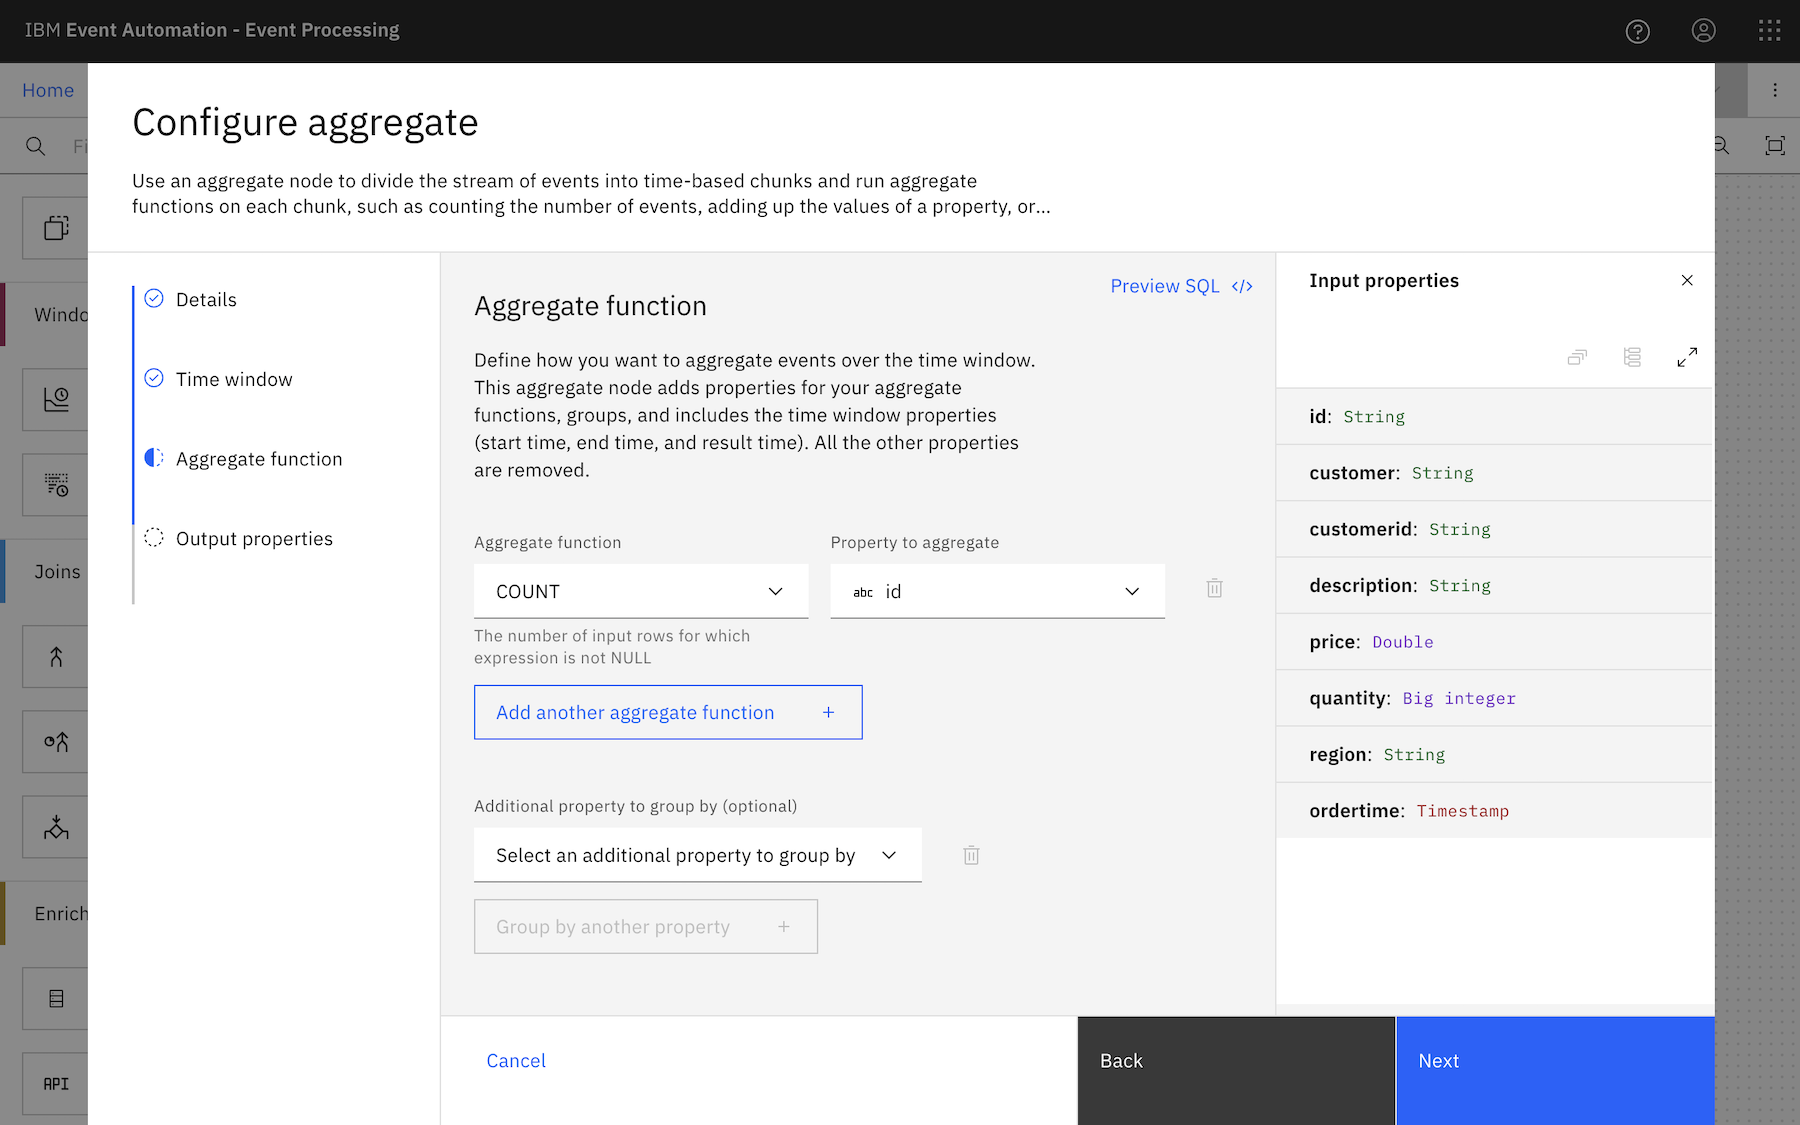
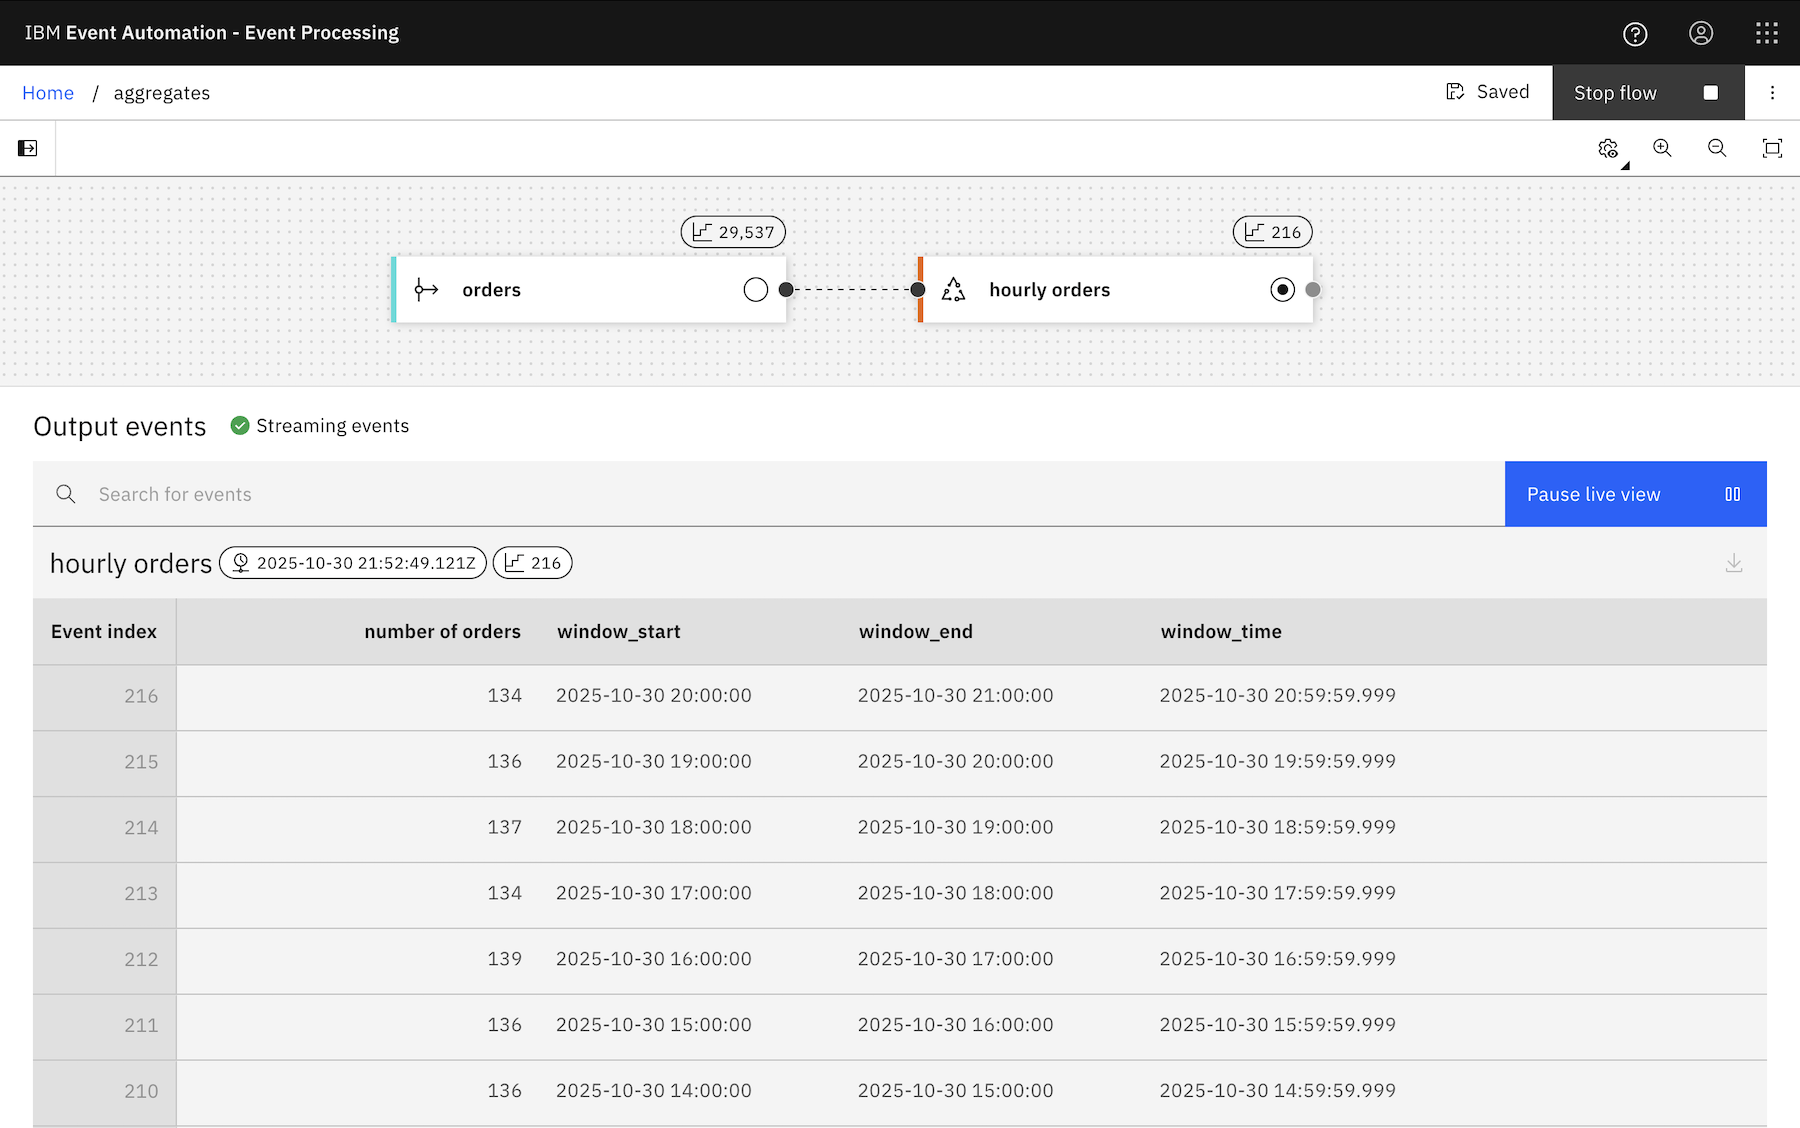
However you do it, the result is a flow that emits a result at the end of every hour, with a count of how many order events were observed during the last hour.
But what if you don’t just want a count of the orders?
What if you want the collection of the actual order events emitted at the end of every hour?
To dream up a scenario using this stream of order events:
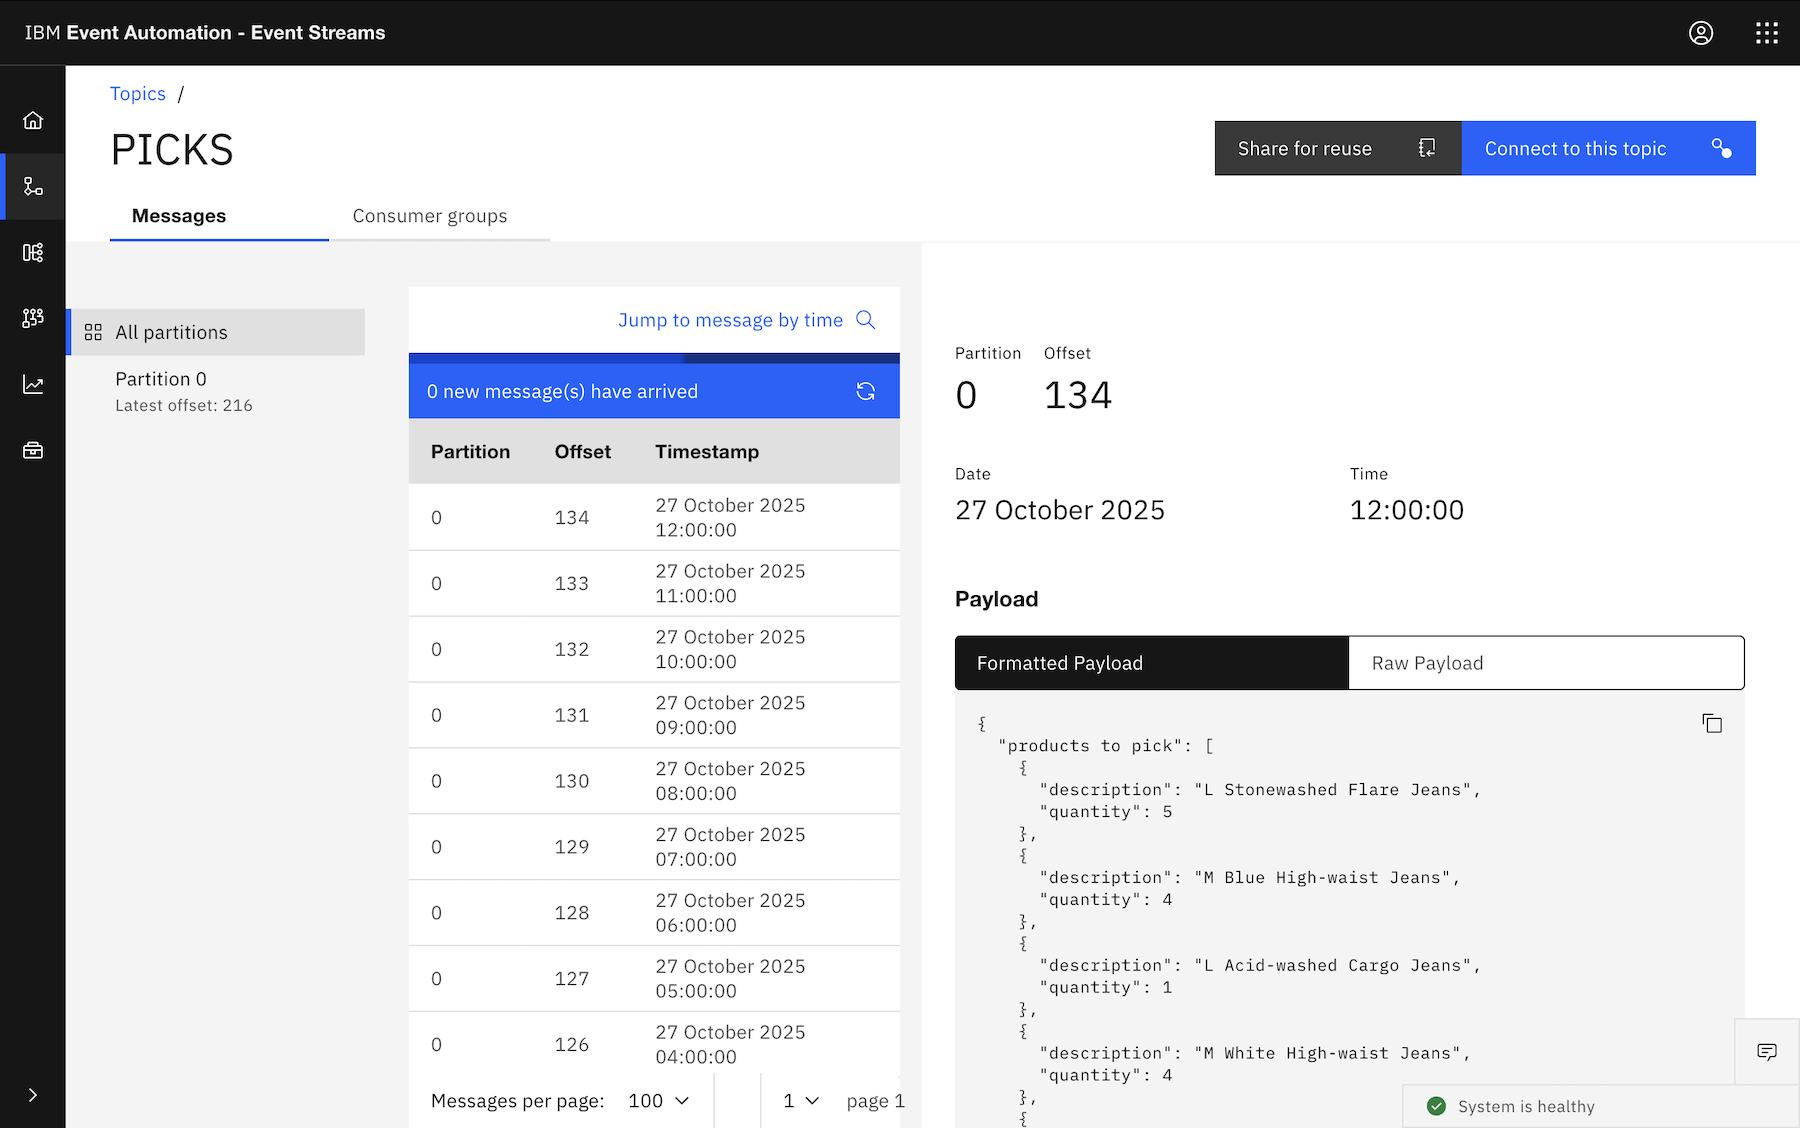
At the end of each hour, emit a list of all products ordered during the last hour, so the warehouse pickers can prepare those items for delivery.
This is where some of the other aggregate functions in Flink SQL can help.
LISTAGG
If you just want a single property (e.g. the name / description of the product that was ordered) from all of the events that you collect within each hourly window, then LISTAGG can help.
For example:
SELECT
    LISTAGG (description) AS `products to pick`,
    window_start,
    window_end,
    window_time
FROM
    TABLE (
        TUMBLE (
            TABLE orders,
            DESCRIPTOR (ordertime),
            INTERVAL '1' HOUR
        )
    )
GROUP BY
    window_start,
    window_end,
    window_time
That gives you a concatenated string, with a comma-separated list of all of the product descriptions from each of the events within each hour.
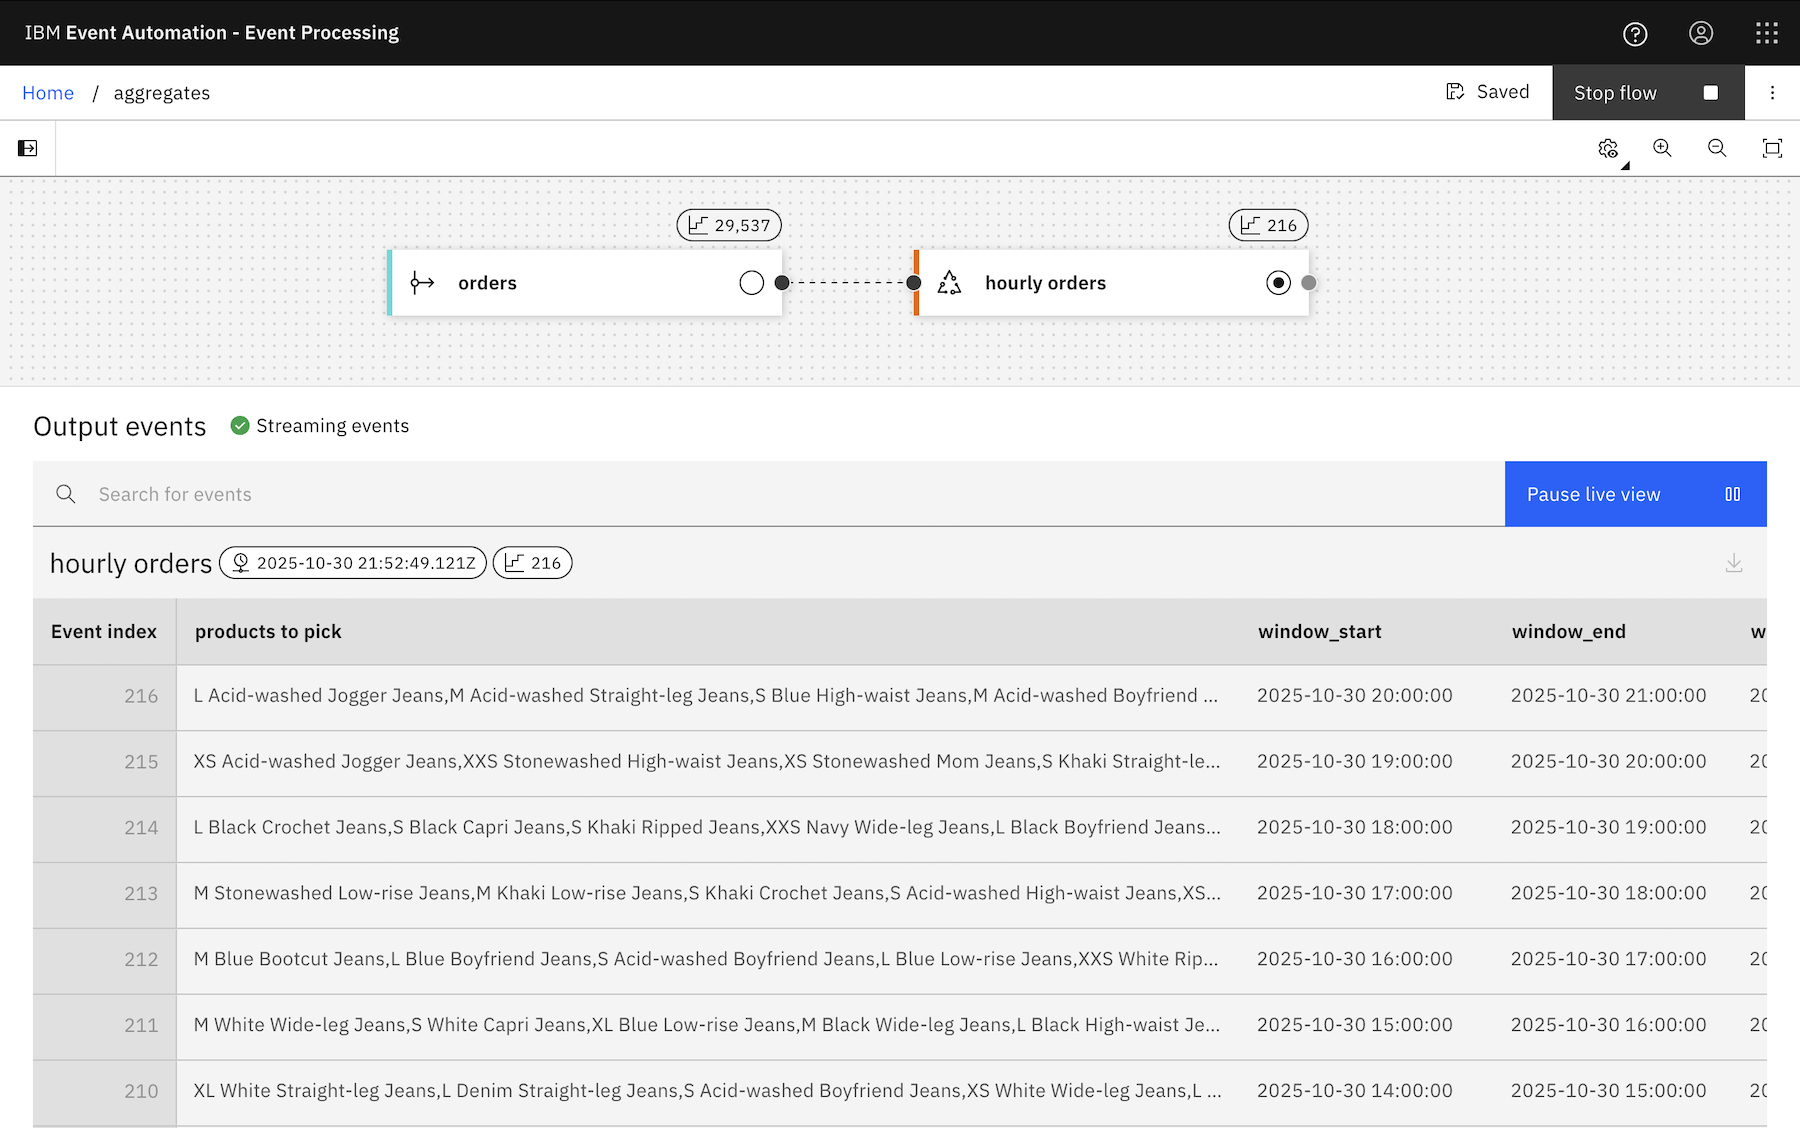
You can use a different separator, but it’s a comma by default.
ARRAY_AGG
If you want to output an object, with some or even all of the properties (e.g. the name and quantity of the products that was ordered) from all of the events that you collect within each hourly window, then ARRAY_AGG can help.
For example:
SELECT
    ARRAY_AGG (
        CAST (
            ROW (description, quantity)
                AS
            ROW <description STRING, quantity INT>
        )
    ) AS `products to pick`,
    window_start,
    window_end,
    window_time
FROM
    TABLE (
        TUMBLE (
            TABLE orders,
            DESCRIPTOR (ordertime),
            INTERVAL '1' HOUR
        )
    )
GROUP BY
    window_start,
    window_end,
    window_time
The CAST isn’t necessary, but it lets you give names to the properties instead of the default names you get such as EXPR$0, so downstream processing is easier.
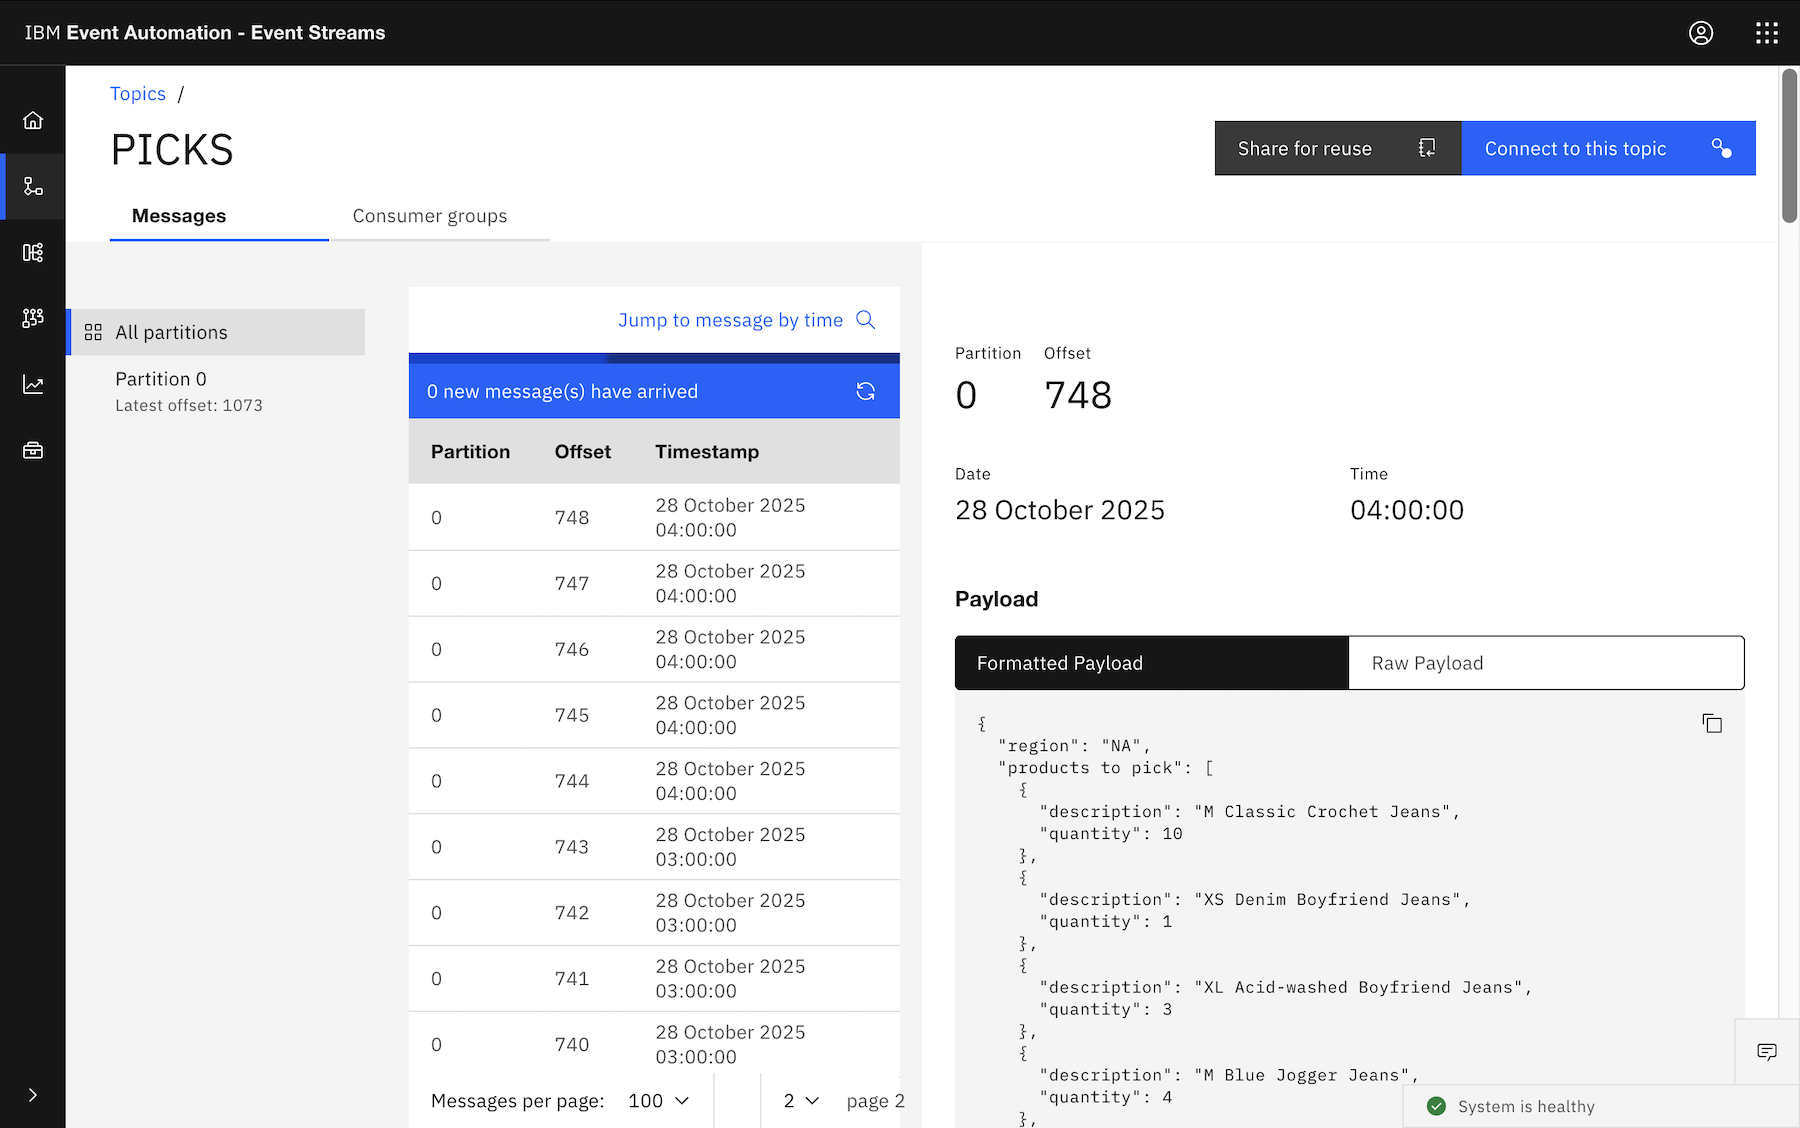
In each hour, an event is emitted that contains an array of objects, made up of properties from the events in that hour.
And naturally you could add additional GROUP BY, for example, if you wanted a separate pick list event for each region:
SELECT
    region,
    ARRAY_AGG (
        CAST (
            ROW (description, quantity)
                AS
            ROW <description STRING, quantity INT>
        )
    ) AS `products to pick`,
    window_start,
    window_end,
    window_time
FROM
    TABLE (
        TUMBLE (
            TABLE orders,
            DESCRIPTOR (ordertime),
            INTERVAL '1' HOUR
        )
    )
GROUP BY
    window_start,
    window_end,
    window_time,
    region
This outputs five events at the end of every hour, one with a list of each of the orders for the NA, SA, EMEA, APAC, ANZ regions.
Try it yourself
I’ve used the “Loosehanger” orders data generator in these examples, so if you want to try it for yourself, you can find it at
github.com/IBM/kafka-connect-loosehangerjeans-source.
If you want to try it in Event Processing, the instructions for setting up the tutorial environment can be found at
ibm.github.io/event-automation/tutorials.
Using time series models with IBM Event Automation
Tuesday, July 22nd, 2025Intro

Imagine you run a city e-bike hire scheme.
Let’s say that you’ve instrumented your bikes so you can track their location and battery level.
When a bike is on the move, it emits periodic updates to a Kafka topic, and you use these events for a range of maintenance, logistics, and operations reasons.
You also have other Kafka topics, such as a stream of events with weather sensor readings covering the area of your bike scheme.
Do you know how to use predictive models to forecast the likely demand for bikes in the next few hours?
Could you compare these forecasts with the actual usage that follows, and use this to identify unusual demand?
Time series models
A time series is how a machine learning or data scientist would describe a dataset that consists of data values, ordered sequentially over time, and labelled with timestamps.
A time series model is a specific type of machine learning model that can analyze this type of sequential time series data. These models are used to predict future values and to identify anomalies.
For those of us used to working with Kafka topics, the machine learning definition of a “time series” sounds exactly like our definition of a Kafka topic. Kafka topics are a sequential ordered set of data values, each labelled with timestamps.
(more…)
How to use kafka-console-consumer.sh to view the contents of Apache Avro-encoded events
Thursday, June 12th, 2025kafka-console-consumer.sh is one of the most useful tools in the Kafka user’s toolkit. But if your topic has Avro-encoded events, the output can be a bit hard to read.
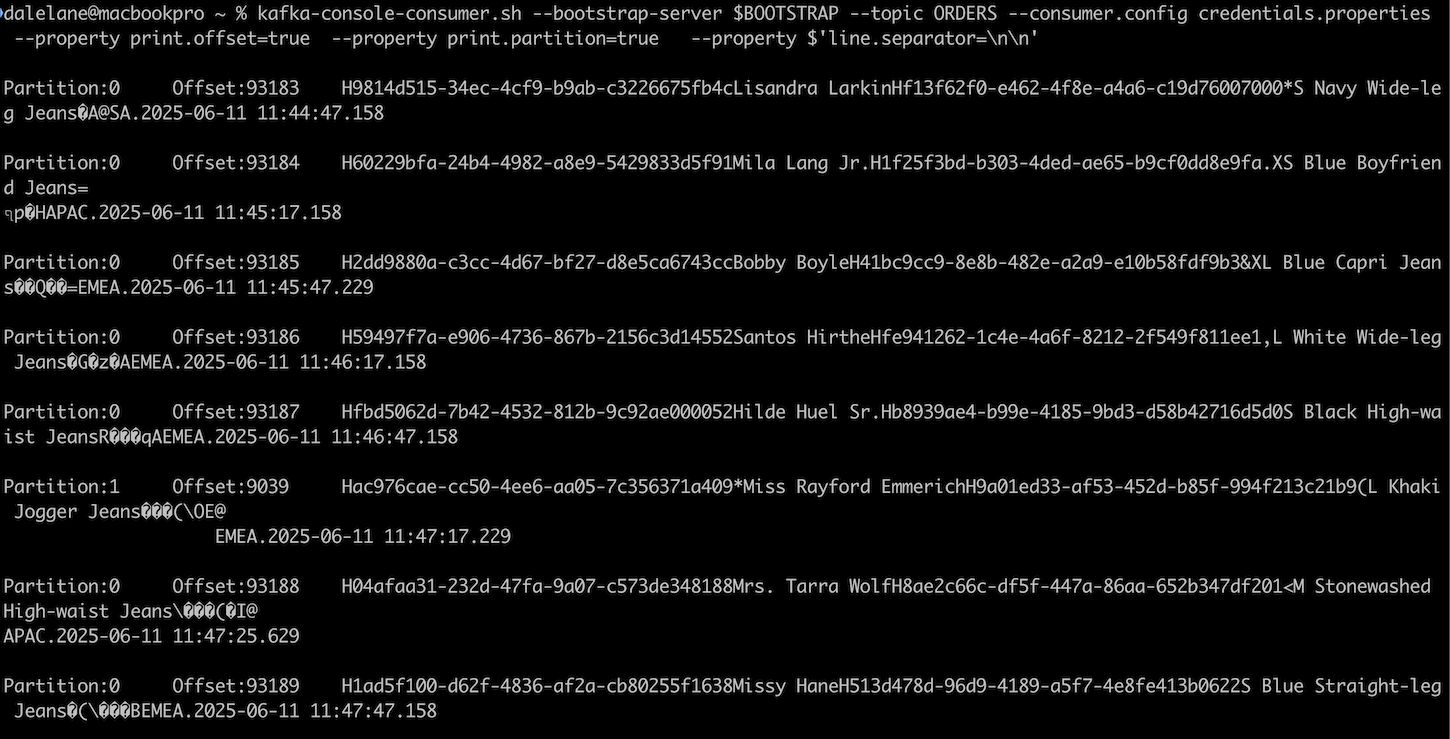
You don’t have to put up with that, as the tool has a formatter plugin framework. With the right plugin, you can get nicely formatted output from your Avro-encoded events.
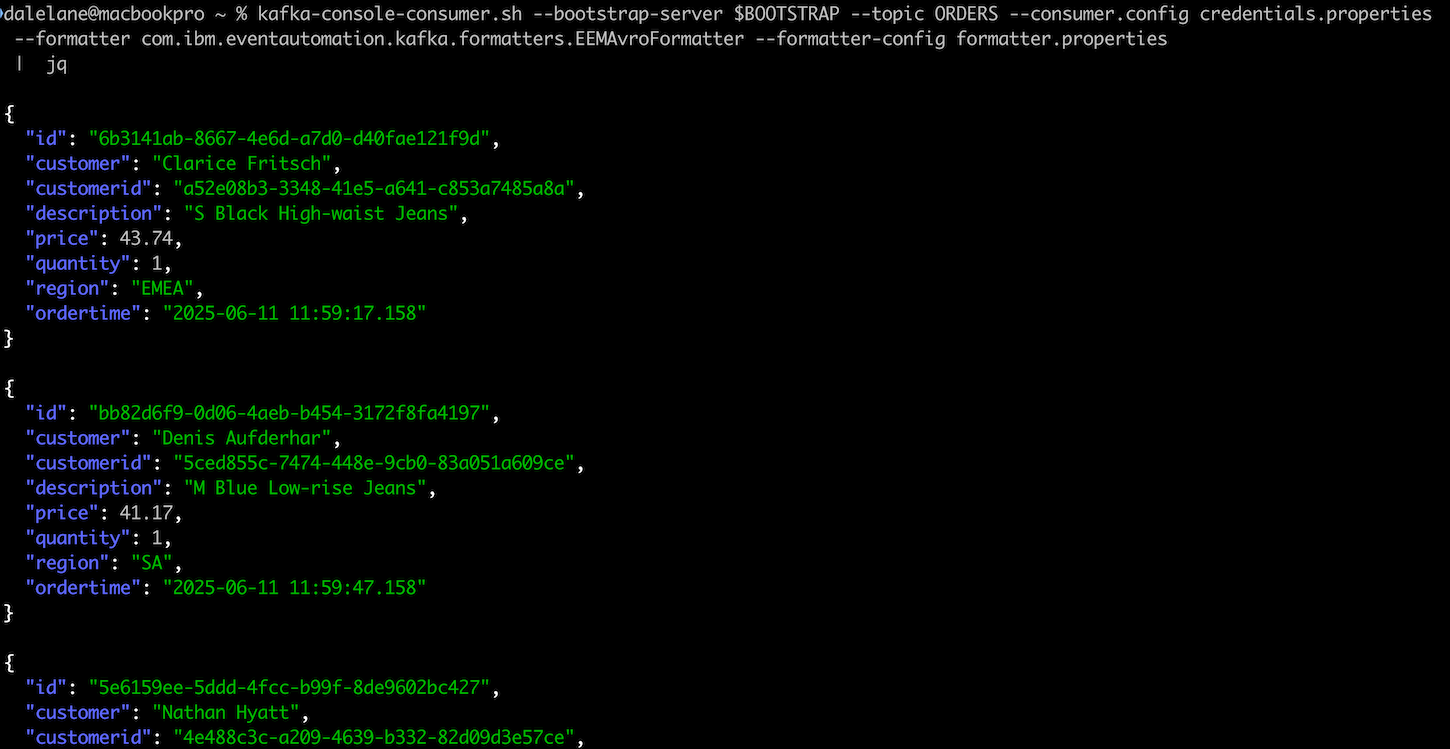
With this in mind, I’ve written a new Avro formatter for a few common Avro situations. You can find it at:
github.com/IBM/kafka-avro-formatters
The README includes instructions on how to add it to your Kafka console command, and configure it with how to find your schema.
Using annotations to store info about Kafka topics in Strimzi
Sunday, June 1st, 2025In this post, I highlight the benefits of using Kubernetes annotations to store information about Kafka topics, and share a simplified example of how this can even be automated.
Managing Kafka topics as Kubernetes resources brings many benefits. For example, they enable automated creation and management of topics as part of broader CI/CD workflows, it gives a way to track history of changes to topics and avoid configuration drift as part of GitOps processes, and they give a point of control for enforcing policies and standards.
The value of annotations
Another benefit that I’ve been seeing increasing interest in recently is that they provide a cheap and simple place to store small amounts of metadata about topics.
For example, you could add annotations to topics that identify the owning application or team.
apiVersion: kafka.strimzi.io/v1beta2
kind: KafkaTopic
metadata:
  name: some-kafka-topic
  annotations:
    acme.com/topic-owner: 'Joe Bloggs'
    acme.com/topic-team: 'Finance'
Annotations are simple key/value pairs, so you can add anything that might be useful to a Kafka administrator.
You can add links to team documentation.
apiVersion: kafka.strimzi.io/v1beta2
kind: KafkaTopic
metadata:
  name: some-kafka-topic
  annotations:
    acme.com/documentation: 'https://acme-intranet.com/finance-apps/some-kafka-app'
You can add a link to the best Slack channel to use to ask questions about the topic.
apiVersion: kafka.strimzi.io/v1beta2
kind: KafkaTopic
metadata:
  name: some-kafka-topic
  annotations:
    acme.com/slack: 'https://acme.enterprise.slack.com/archives/C2QSX23GH'
npx dalelane
Tuesday, May 13th, 2025If you’re a Node.js person, try running: npx dalelane
I recently read Ashley Willis’ blog post about her “terminal business card” – a lovely project she shared that prints out a virtual CLI business card if you run npx ashleywillis.
Check out her blog post for the history of where this all started, and an explanation of how it works.
I love this!
npx dalelane

Blast from the past
It reminds me (and I’m showing my age here) of the finger UNIX command we had in my University days.
Other than IRC, finger was our social media: we maintained .plan and .project files in our profile directory, and anyone else at Uni could run finger <username> to see info about you and what you’re up to.
We created all sorts of endlessly creative ASCII-art plan files, and came up with all sorts of unnecessarily elaborate ways to automate updates to those files.
I haven’t thought about that for years, but Ashley’s project reminded me of it so strongly that I had to give it a try.
npx dalelane

A dynamic business card needs live data
Her blog post explains how to get it working. I mostly just shamelessly copied it. But where her project is elegant and concise, I naturally crammed in noise. 🙂
I wanted live data, so I updated my “business card” to include what I’m currently reading (from my Goodreads profile), the most recent video game I’ve played (from my Backloggd profile), the most recent song I’ve listened to (from my Last.fm profile) and my most recent post from Bluesky.
(It is a little bit hacky and scrape-y, but realistically it’ll be run so infrequently I don’t feel like it’ll cause any harm!)
Try it for yourself!
You can see my fork of the project at
github.com/dalelane/dalelane.dev-card.
Visualising Apache Kafka events in Grafana
Monday, May 5th, 2025In this post, I want to share some ideas for how Grafana could be used to create visualisations of the contents of events on Apache Kafka topics.
By using Kafka as a data source in Grafana, we can create dashboards to query, visualise, and explore live streams of Kafka events. I’ve recorded a video where I play around with this idea, creating a variety of different types of visualisation to show the sorts of things that are possible.
To make it easy to skim through the examples I created during this run-through, I’ll also share screenshots of each one below, with a time-stamped link to the part of the video where I created that example.
Finally, at the end of this post, I’ll talk about the mechanics and practicalities of how I did this, and what I think is needed next.