What do I do at work?

February 21st, 2010

I’ve been an Emerging Technologies Specialist for about a year and a half now. As I mentioned when I got the job, I don’t know of anywhere that I can point people at that explains what my team do.

I’ve been wary of filling this gap myself, partly because the work that the team does is so diverse that I’m not going to do us justice. But, allowing for the fact that I’ll miss a ton of cool stuff that my colleagues do, I figure that I should try and describe what I do.

I work in the Emerging Technology Services team.

How to explain this?

Read the rest of this entry »

Why I use vdr for TV

February 11th, 2010

Both here and on twitter, I’ve mentioned a few of the things I’ve done with my vdr-based media computer. In this post, I want to quickly take a step back and explain what made me go for this setup in the first place.

By way of quick background, we’ve now got an Asrock Ion 330 living under the TV as a set-top box, connected to the TV via an HDMI cable, and receiving a digital freeview signal over USB from the twin tuners in a Sony Play-TV. It’s quiet, has reasonably low power requirements, is small and pretty, can be controlled by a remote control using a small infra-red receiver plugged into a USB port, and has plenty of storage between it’s own hard-drive and the 500 GB on the Western Digital My Book attached over USB.

This isn’t a “why I use vdr instead of MythTV (or any other open-source HTPC software” post. Mainly because I don’t know enough about the alternatives to talk about them intelligently.

Instead, I wanted to explain why I went for setting up a Linux computer with a TV card instead of just buying another set-top box appliance when ours died last year. It’s not as simple (set-top boxes pretty much set themselves up nowadays) and certainly wasn’t cheaper (largely because I was starting from scratch – if I already had a server to use, that’d be different). So what was the incentive?

Read the rest of this entry »

Book review: Matplotlib for Python Developers

February 11th, 2010

Matplotlib for Python Developers, Sandro Tosi

Let me get the boring disclaimer-y bit out of the way first: I didn’t buy this book – Packt Publishing sent me a free copy in return for me writing a review of it. They’ve not made any specific requests about the contents of my review, just that I should write a review. And, in fact, I should give them props for not hassling me for not getting around to writing this until now – about eight weeks after they sent it. So either they forgot they sent it to me, or they are terribly patient. I’m choosing to assume it’s the latter 🙂

With that out of the way… matplotlib is a graphing library. I’ve used it a lot for my CurrentCost energy monitoring app – all of the graphs in the app are created using matplotlib. And while it is very powerful, it can be a little tricky to get your head around. I still struggle with getting the graphs exactly how I want them even now.

That was why I agreed to do this review – I liked the sound of the book and thought it’d be useful for me.

Overall, it’s a really good book. It starts off going through all the basics, both in terms of explaining the ideas and concepts, and in the practical steps needed to get set up. I’m not normally a big fan of reading text books, preferring to figure stuff out for myself as I go along, but found that even here I picked up tips that I never knew and subtle features that I’d missed.

A nice flow-chart kicks off the detail into producing different types of graphs and chart. It starts from asking “What would you like to show?” (e.g. comparison; distribution; composition; relationship; etc.).

Following this through for what you want to show, and what type of data you have, leads you to a suggestion for the type of graph that is most appropriate for your needs (e.g. line histogram; waterfall chart; pie chart; stacked column chart; scatter chart; etc.). For someone like me who doesn’t have the world’s strongest maths background, this was a really useful guide.

Read the rest of this entry »
last.fm for television

January 6th, 2010

One of the social network sites I’ve been using the longest is last.fm.

(If you know what last.fm is, bear with me teaching you to suck eggs for a few paragraphs… it gets more interesting – honest!)

The idea of last.fm is that a background service captures (or “scrobbles“) the music that I listen to on my computer at home, on the mp3 player that I use in the car, and on my laptop in the office.

This means that I now have a large record detailing the music I’ve listened to over the last three years.

I do this for a few reasons, including:

  • The data is made available to me through a rich API, which means I’m free to play with it, as well as take advantage of the creations of others, such as the wonderful visualisations generated by lastgraph
  • I can see what my friends listen to, which is interesting, as well as being a good way to come across new music
  • last.fm use this detailed history of my music-listening tastes to make automated recommendations of other music that I might like

This is all a long-winded way of saying that I like last.fm. I find it useful and interesting, and want the same for all the media that I consume – not just music.

I went looking for an equivalent for the books that I read in August 2008, and started using goodreads.

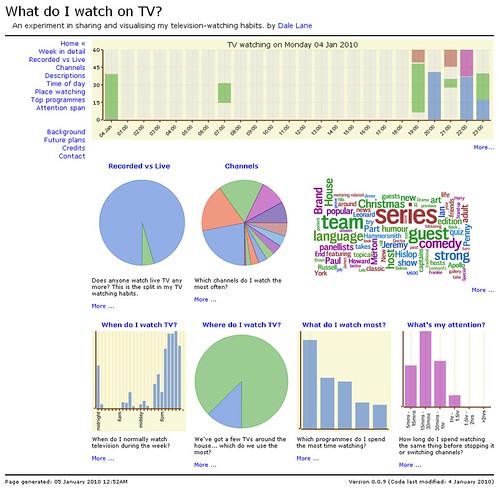
But what about the television that I watch? Could I create a last.fm-style scrobbler to capture what I watch on television? And then try and come up with a few examples of how I could share and visualise the data?

This question is where I started at Christmas… and after a few evenings of hacking some Python together, I’ve come up with:

last.fm for television

Please go take a look. (needs Flash – sorry)

Read the rest of this entry »

What will Smart Metering look like in the UK?

December 6th, 2009

This week, the UK government published their response to the consultation that ran over the summer. Basically, they asked how smart metering should be implemented in the UK, offered some proposals, and invited anyone to tell them what they think.

In case I hadn’t already convinced people that I was a geek, I read through the Government response paper. It basically reiterates the proposals that were outlined before the summer, summarises the responses that they received, and states the decisions that they have reached as a result.

Is it really very geeky that I found this interesting?

I wanted to highlight a few bits in particular…

… mandate a roll out of electricity and gas smart meters to all homes in Great Britain with the aim of completing the roll out by the end 2020 …

In case you missed all the press about this in the past week, the plan is still that we’re all getting smart meters, and it’ll happen in the next ten years.

Read the rest of this entry »

We’re moving

November 29th, 2009

Warwick Court - front

Solent Youth Action started life as a youth volunteering project at One Community (then Eastleigh Community Services). With only a couple of staff in the early days, we didn’t need a lot of space.

Even after we spun off as an independent charity in 2006, we still remained based at One Community – moving from being a project there, to a tenant, renting a serviced office.

As we’ve grown, we’ve managed to rent a couple of extra offices in One Community, which helped us stay there for a little longer. But as we’ve continued to grow, and as more staff joined the team, we’ve run out of room and had to start looking for our own space.

This week finally brought completion – we finally signed the lease for what will be our new main offices.

Read the rest of this entry »

How much did I spend on electricity to do that?

November 27th, 2009

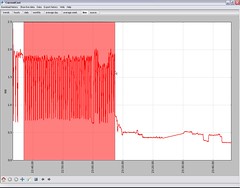
Selecting a chunk of a graphTime for number 73 in my never-ending list of ever-so-slightly-different things to try with a graph of home energy usage data

🙂

This time… working out the electricity used (and the cost) of doing… well, something in particular.

We already have live graphs (Switch something on and watch the graph shoot up. Switch it off and watch the line drop.)

And we’ve already got graphs with hourly, daily, or monthly totals.

But if I boil a kettle, how do I know how much that cost?

The live graph shows you the shape of the usage curve for a particular appliance.

What I wanted was to be able to start the live graph running, switch something on, then after it’s finished, go back to the live graph, see the bump in the graph for when I did that, and measure the area under it – giving me my total energy usage for that time.

A quick bit of Python-tinkering later, and here we go

Click-and-drag to highlight a span of the graph, and the Python script calculates the area (more-or-less) under that part of the curve, using this to calculate how much energy I used during this time.

Read the rest of this entry »

What happened to the integration?

November 17th, 2009

A bunch of social networking updates arrived tonight for the Xbox 360. There has been talk of twitter integration in the Xbox 360 since E3 last summer. And after all the wait… I was a little disappointed.

Because it isn’t integration.

It’s a simple stand-alone twitter client app, that you can run on the Xbox. It joins the main menu becoming something else you can run, instead of play a game or media.

That’s not integration.

If they’d added the ability to receive replies/mentions and direct messages through the Xbox messaging platform while you’re in a game (as it does already with MSN Messenger messages)… that would be integrated.

If they’d built it in to Xbox’s Achievements system, so that when you complete an achievement it offered the chance to let your followers know what you’ve achieved… say by popping up a text box prefilled with a message and a link to more info about the game you’re playing… that would be integrated.

If they’d added the ability to capture a screenshot of what you’re doing, upload it to twitpic (or some similar service) and tweet to show your followers something cool… that would be integrated.

If they’d added the chance to see compare your twitter friends list with your Xbox friends list, and add any that aren’t on both… that would be integrated.

If they’d included a twitterfone-type service to let you tweet without typing, just by talking into the Xbox headset… that would be integrated.

I’m not saying that any of these are good ideas (they’re just the first few things off the top of my head), but the point is that this sort of thing would make twitter feel like it has been integrated into the “Xbox Experience“.

Read the rest of this entry »