Drawing pretty graphs with Open Flash Chart

December 19th, 2008

I’m keen for young people that Solent Youth Action works with to have access to information about how the charity runs. I’d like for us to be as transparent as possible, and as a geek, one of the ways that I am working on this is by putting more stuff on our website.

We put our Financial Statements online so that people could see where we get our money from, and how we spend it. But it’s a dry document – a twenty-two page PDF of numbers and accounting blurb.

While it is important for this information to be available, it’s not easily accessible to many like this. Tonight I had a play with presenting it as animated online graphs using the awesome Open Flash Chart.

The Open Flash Chart site has very clear tutorials and a ton of examples, so I wont waste time here by going into detail explaining how to use it.

But it’s worth highlighting just how simple it is – drop the swf file into a directory on your webserver, then point it at a JSON file with your data (either by URL, or by reference in your HTML). That’s pretty much it.

The most complicated bit was copying figures out of the Financial Statements document and pasting it into a JSON text file. Even this was fairly quick.

Flash graphs are not as accessible as something like Google Chart images because they require Flash to be installed. However, I hope the visual flair they add makes up for this, and will help grab the attention of our volunteers.

I created a couple of quick charts to show our income and expenditure, but there are many more examples of how to use it here and here.

Lapland UK

December 16th, 2008

On Friday, we took the kids to Lapland UK.

The first reaction I got when I mentioned this to people generally went along the lines of “OMG, you’re going there?! I heard about them in the news!”.

It’s not the same place. This isn’t the New Forest Lapland-themed attraction that made the headlines so spectacularly a couple of weeks ago – it’s a place in Kent.

Even their website has a banner on the top to reassure visitors saying: “Please be assured Lapland UK has NO association with Lapland New Forest”.
Hmmm… I guess they have a bit of a brand problem, at least in the short-term.

With this in mind, and as we had such a lovely day there, I thought I’d do my little bit to help their image by sharing our experience.

Read the rest of this entry »

A letter to Littlewoods Direct. Or why you’ve got to read the small print

December 15th, 2008

People who follow my tweets may have already heard my moaning about Littlewoods on Friday, but I’m still hacked off about it enough to post about it here too.

I have written them a letter (in the perhaps misguided belief that paper letters get more attention than emails). The contents are posted below to share my ranting and whining more widely.

Comments are very welcome… am I being too ranty and unreasonable? How much responsibility do we consumers have for reading small-print?

Read the rest of this entry »

CurrentCost – setting yourself a personal goal

December 14th, 2008

One of the themes that came up at HomeCamp was that collecting data about personal energy usage was good, but putting it in a broader context helped make it more effective.

With that in mind, I thought I’d make a small improvement to my CurrentCost app to add a financial context to the data it displays.

I’ve added the ability to specify an annual electricity usage target – it asks the question “How much do you want to spend on electricity in a year?”

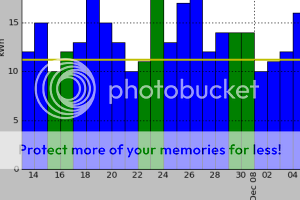
screenshotOnce you answer that, a target line is added to each graph. The target line shows how much electricity you should use in order to meet your goal.
For example, the graph showing daily electricity usage has a horizontal line showing how much electricity usage you can use a day in order to meet your target annual electricity spend. Bars in the graph that are taller than the horizontal line show you exceeding your goal, bars that stay under show you on track.

Read the rest of this entry »

HomeCamp

November 30th, 2008

Yesterday was HomeCamp:

…an unconference about using technology to monitor and automate the home for greener resource use and to save costs. This is about low energy devices and servers, reducing your electricity bills, monitoring your mouse traps, home automation, monitoring your water usage, using solar power…

Fifty or so people came together at Imperial College to talk about how we can reduce our energy usage.

The format was different to other barcamps and unconferences I’ve been to – rather than separate rooms, most of the time was spent with everyone together in a single room. And the talks flowed on from each other – it felt more like a single day-long conversation than a series of separate presentations.

Read the rest of this entry »

Developing for Android

November 26th, 2008

I wrote an admittedly gushing post a few weeks ago about my first impressions of the new “Google phone”, the Android-powered T-Mobile G1. Now that I’ve had a few weeks to play with it, I thought I’d add a comment about some frustrations with it as a developer.

None of this is to retract what I said before – I still agree with what I said before. But it’s worth adding a couple of comments.

I’ve not written any code for Android yet, but I’ve had a couple of tentative looks into how I might. And in general, it seems to be a combination of being really impressed by the theory, followed by being frustrated by the practice.

This is perhaps best described with a couple of examples.

Read the rest of this entry »

Social TV

November 18th, 2008

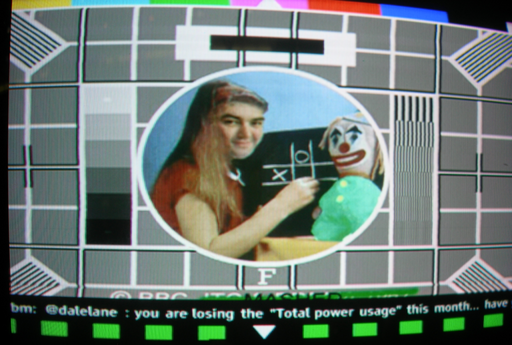
At the BBC hackday “Mashed” earlier this year, I went to a talk explaining how to write applications that can be delivered to televisions through Freeview set-top boxes. For our CurrentCost-themed hack, we reused (that is to say, shamelessly stole!) some code from a colleague to get CurrentCost notifications onto a TV channel. The idea was that it’d be a ‘press the red button’ kind of thing where you could have results of CurrentCost challenges from you and your friends pop up as text overlaid onto the bottom of the screen while you watch TV.

I loved this idea, and it’s been bouncing around at the back of my head since. There is a lot of social network data on the web that I think would be well suited to notifications via a TV. Rather than needing to have a separate computer on, or send stuff to mobile phones, or use stand-alone ambient type devices like Nabaztags or Chumbys, why not have stuff popping up while you watch TV?

Read the rest of this entry »

Thinking about Home Camp

November 17th, 2008

This is a quick post to spread the word about Home Camp to anyone who follows my blog but doesn’t follow Chris Dalby (aka @yellowpark).

I’ve posted a lot about CurrentCost since I got the meter back in May, but in the past few months it seems like lots of people are giving it a try – I’m seeing more tweets and blog posts about the potential of CurrentCost, and I’m getting more and more emails about my Python CurrentCost app.

So I’m really looking forward to Home Camp – Chris’ idea for a CurrentCost-themed unconference, and a chance to discuss and try ideas relating to monitoring our energy use.

Although it’s CurrentCost-inspired, it wont be limited to CurrentCost or even only electricity monitoring. For example, I’ve prepared a short presentation on monitoring home gas usage in a CurrentCost-type way, which I hope will get some ideas going. And I’ve started thinking about how we could monitor personal car petrol usage – probably my most expensive energy bill!

Read the rest of this entry »